
Generated by Edge AI
2026 US Corn Yield Projection Analysis
Executive Summary
Based on 20 years of USDA NASS corn yield data (2006-2025), I've developed a comprehensive projection for 2026 corn yields with associated price implications. This analysis includes enhanced visualizations to better illustrate trends, volatility, and projections.
2026 Corn Yield Projection
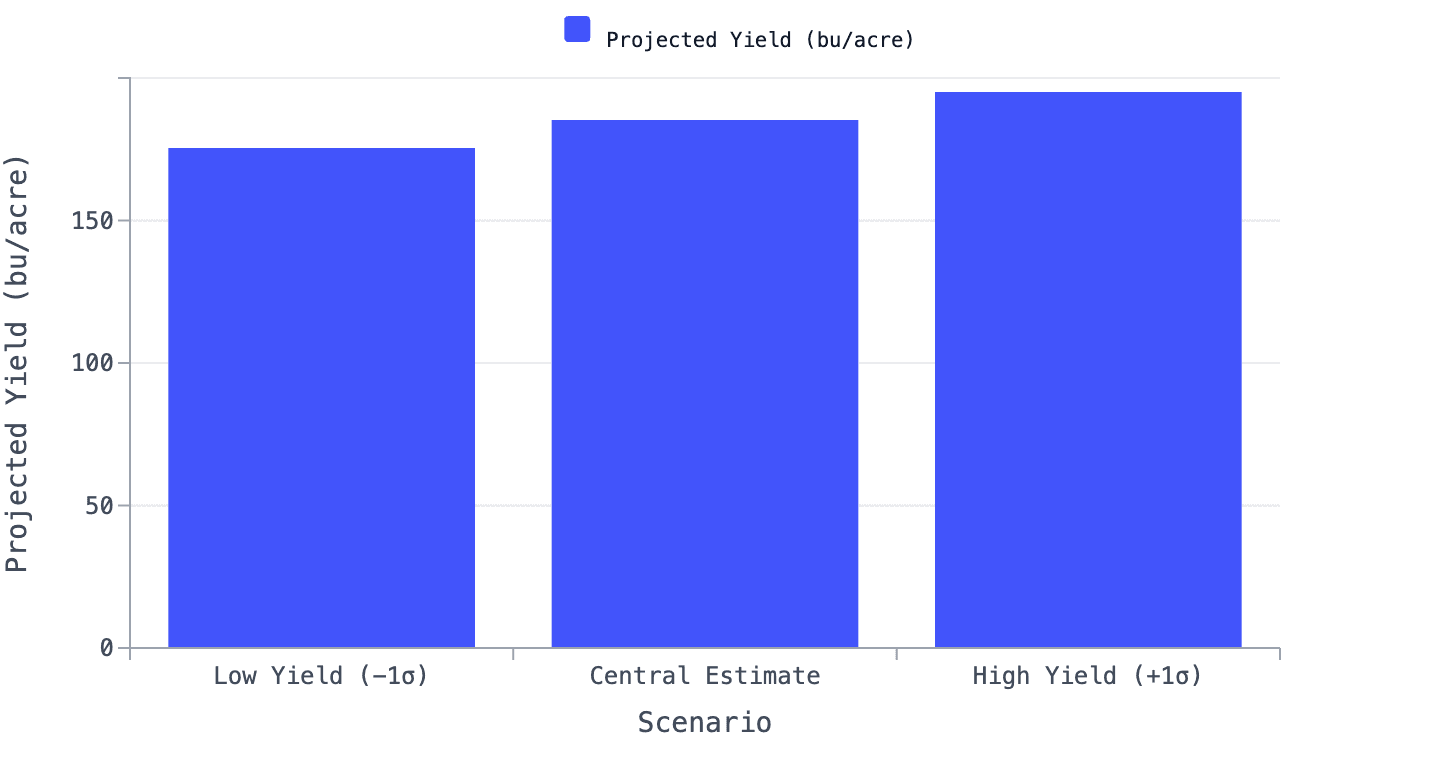
Central Estimate: 185.2 bushels per acre
Confidence Range (±1 Standard Deviation):
Scenario | Yield (bu/acre) | Projected Price | Probability |
|---|---|---|---|
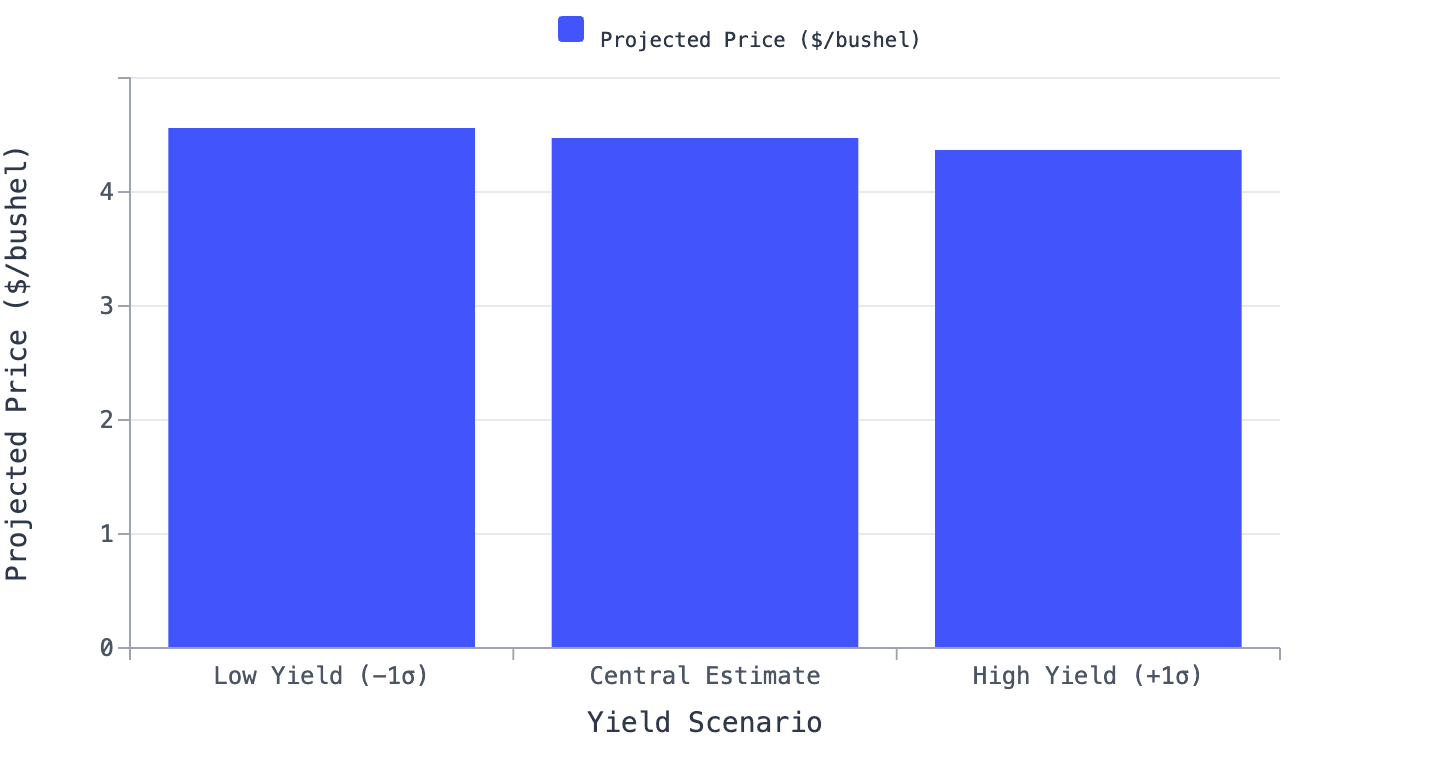
Low Yield (-1σ) | 175.3 | $4.57/bu | ~16% chance of being below |
Central Estimate | 185.2 | $4.47/bu | Most likely outcome |
High Yield (+1σ) | 195.0 | $4.37/bu | ~16% chance of being above |
Range Width: 19.7 bushels per acre (175.3 to 195.0)
Comprehensive Analysis Dashboard
Trend Analysis & Projections
Panel Descriptions:
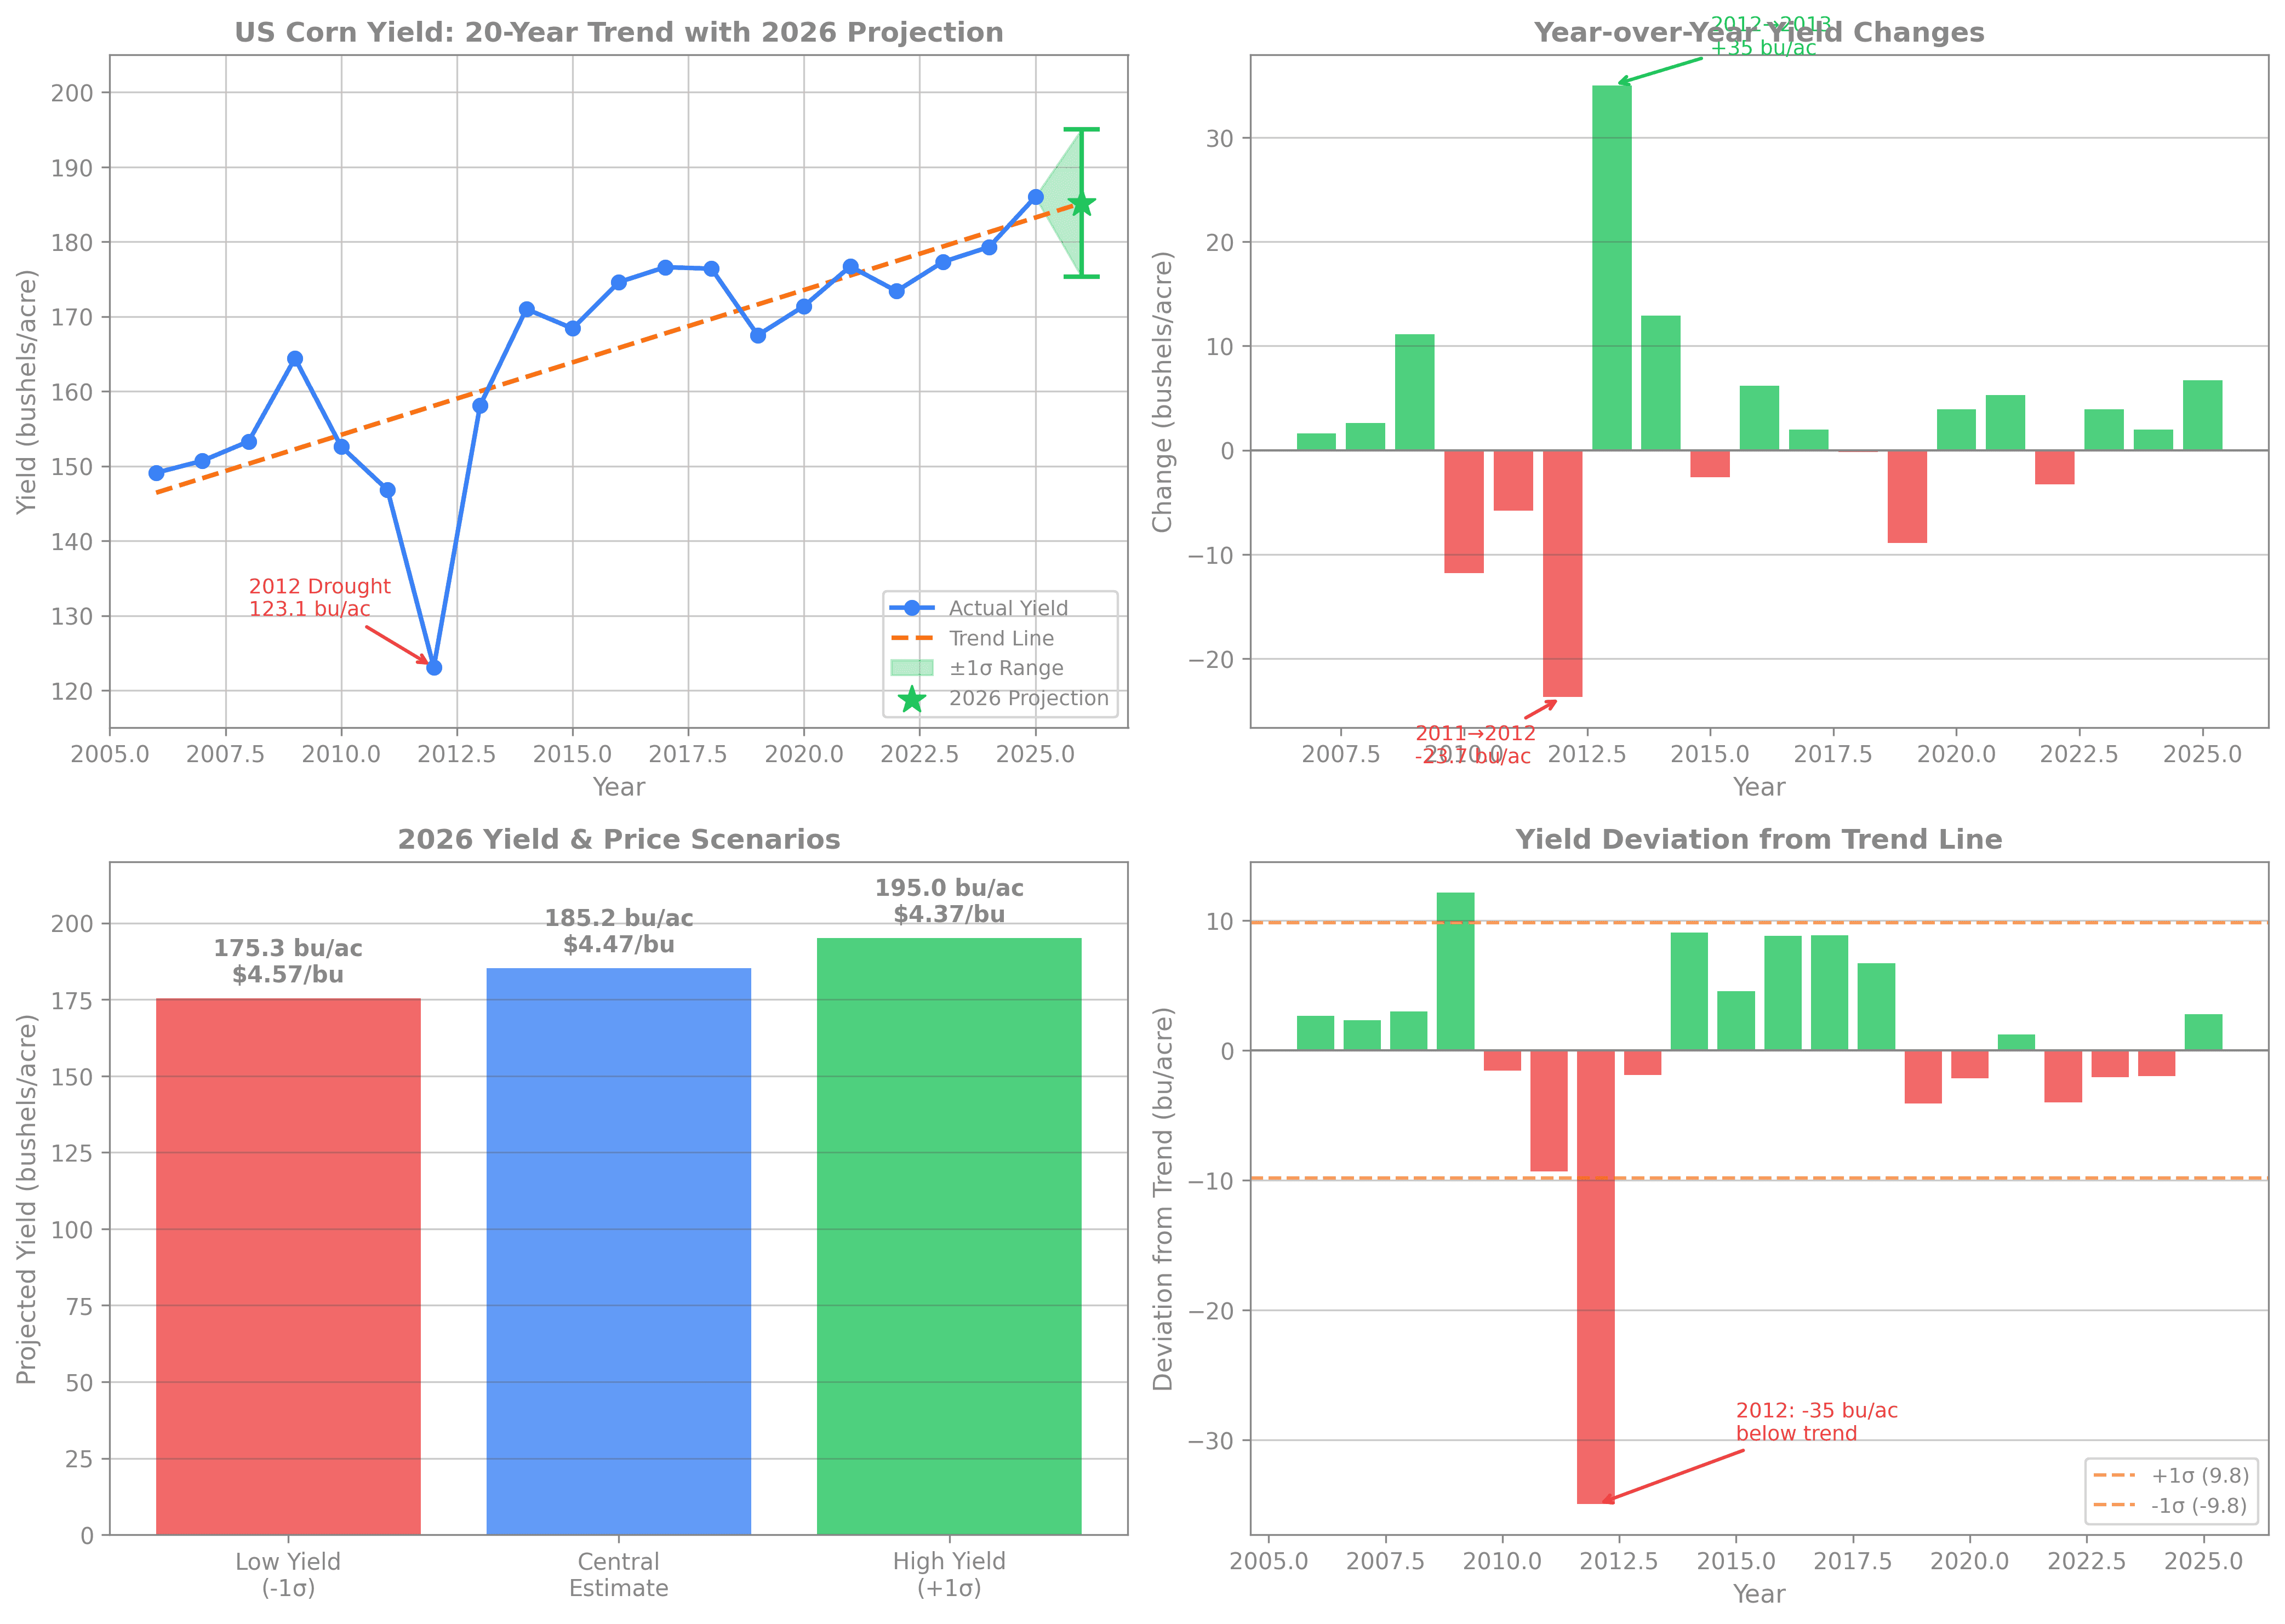
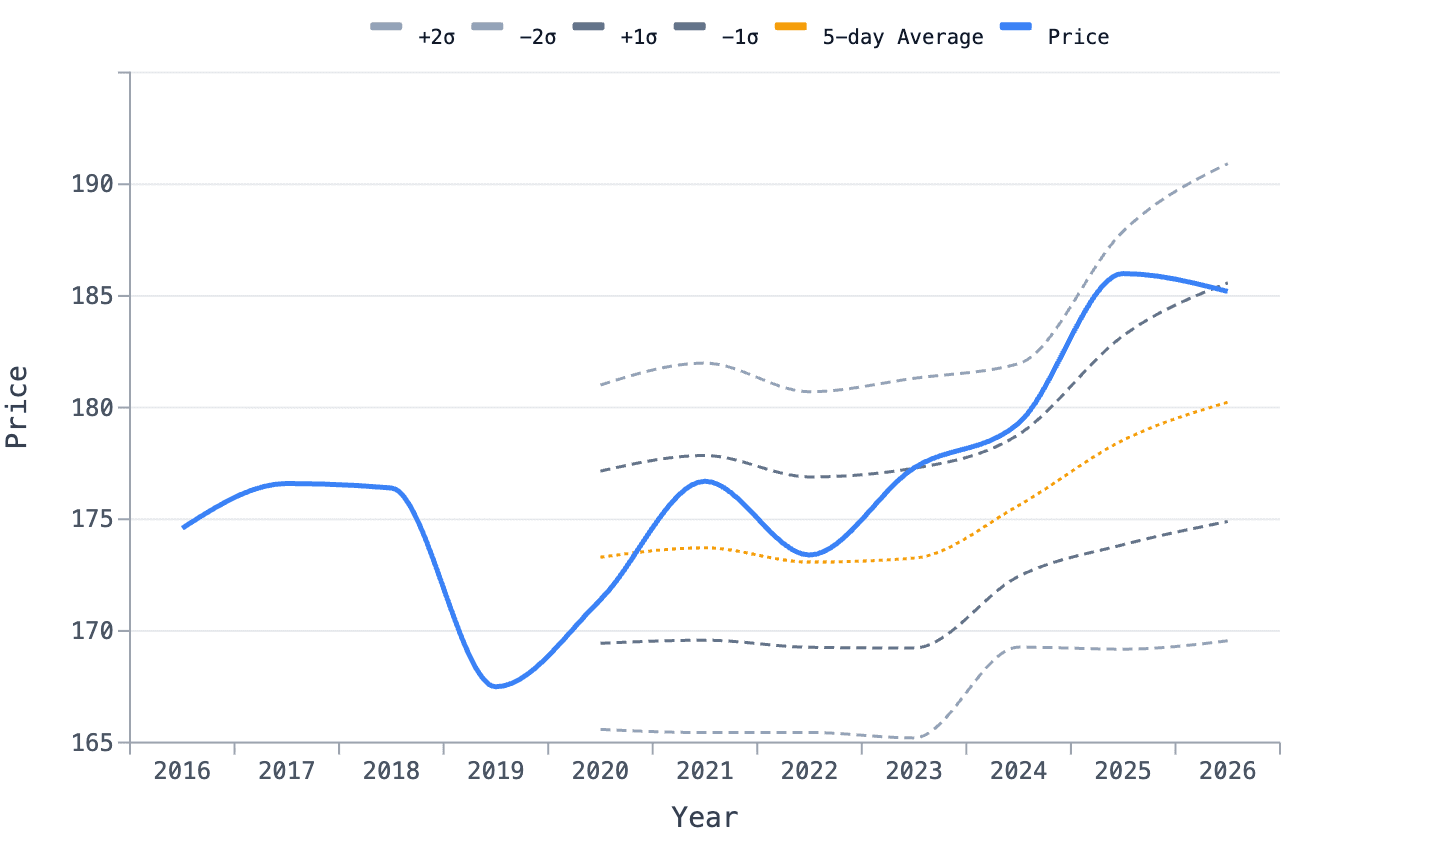
Top Left: 20-year historical yield trend with linear regression and 2026 projection with ±1σ confidence bands
Top Right: Year-over-year yield changes highlighting volatility (green = gains, red = losses)
Bottom Left: 2026 yield scenarios with corresponding price projections
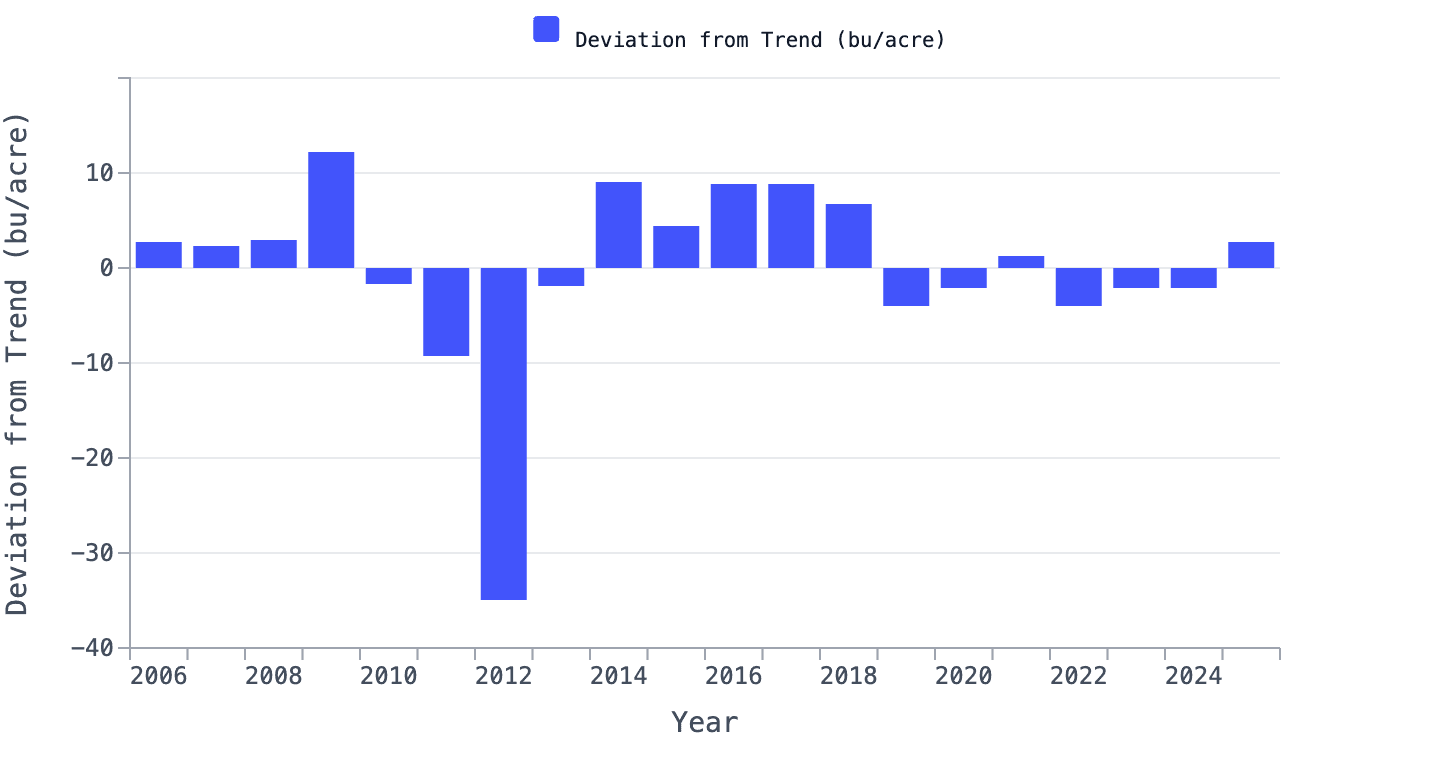
Bottom Right: Deviation from trend analysis showing how each year performed vs expectations
Distribution & Volatility Analysis
Panel Descriptions:
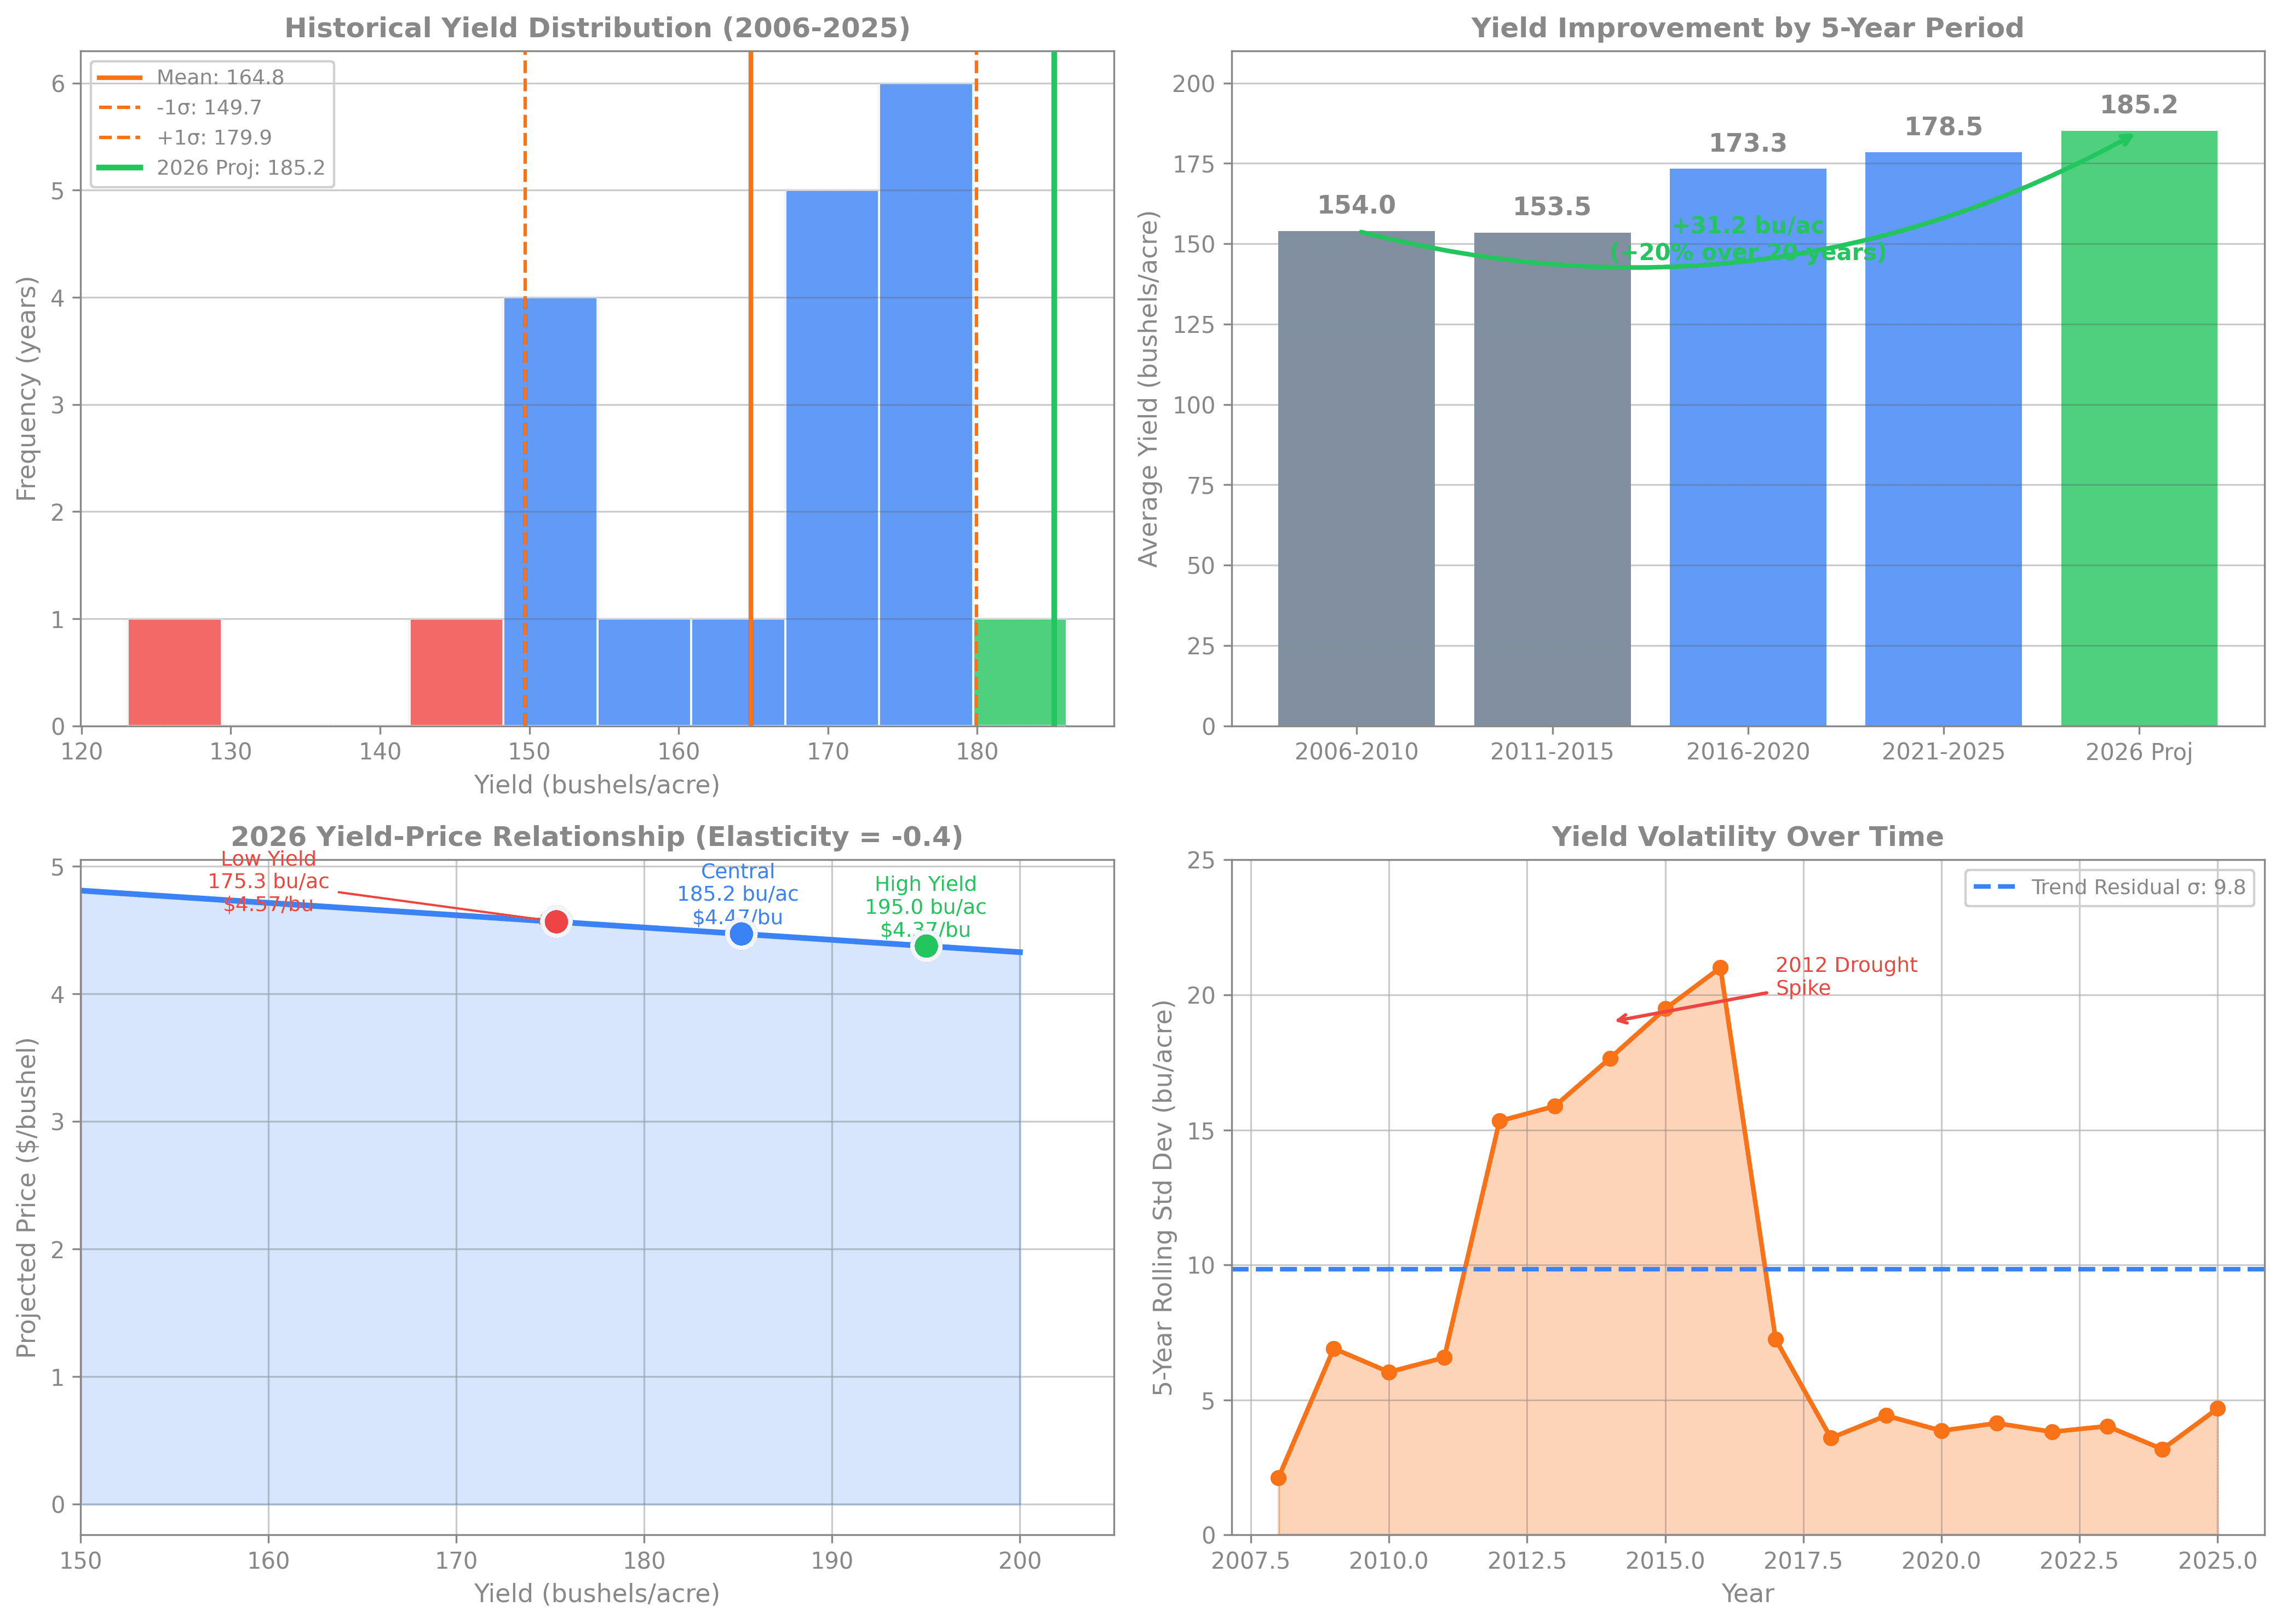
Top Left: Historical yield distribution with mean, ±1σ bands, and 2026 projection marked
Top Right: 5-year period comparison showing +20% yield improvement over 20 years
Bottom Left: Yield-price relationship curve with three scenarios marked
Bottom Right: Rolling 5-year volatility showing how yield stability has improved
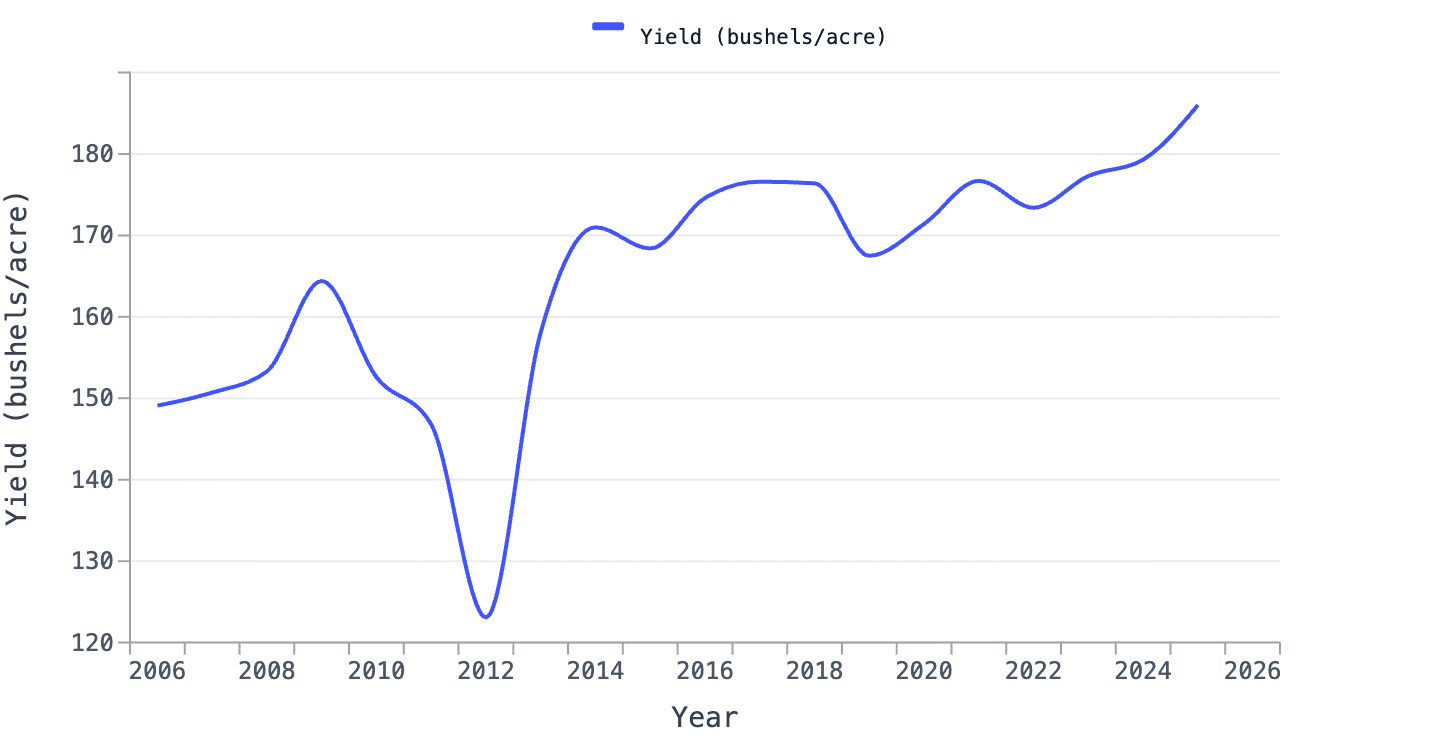
Historical Yield Trend with Trend Line
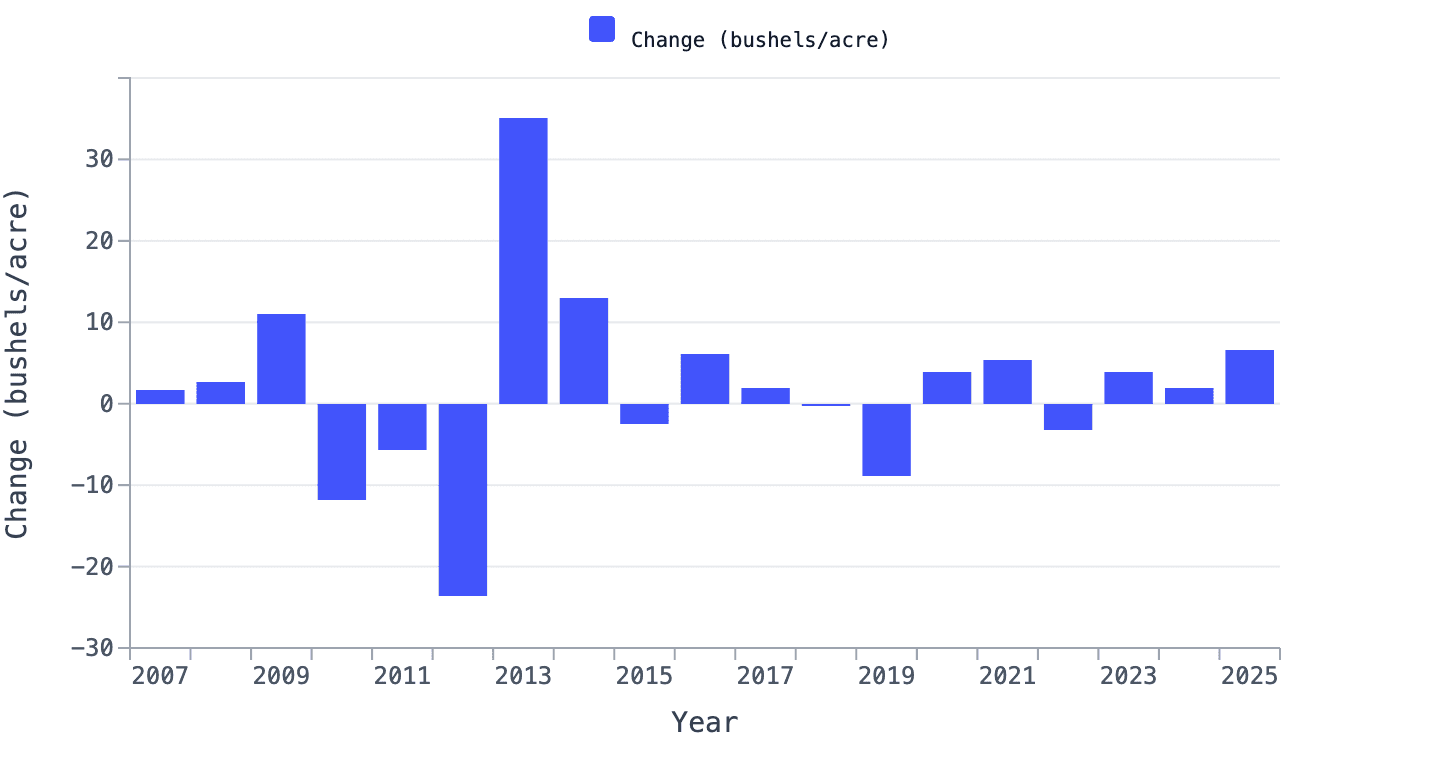
Year-over-Year Yield Changes
Yield Deviation from Trend
Yield with Volatility Bands (2016-2026)
2026 Yield Projection Scenarios
2026 Price Projections by Yield Scenario
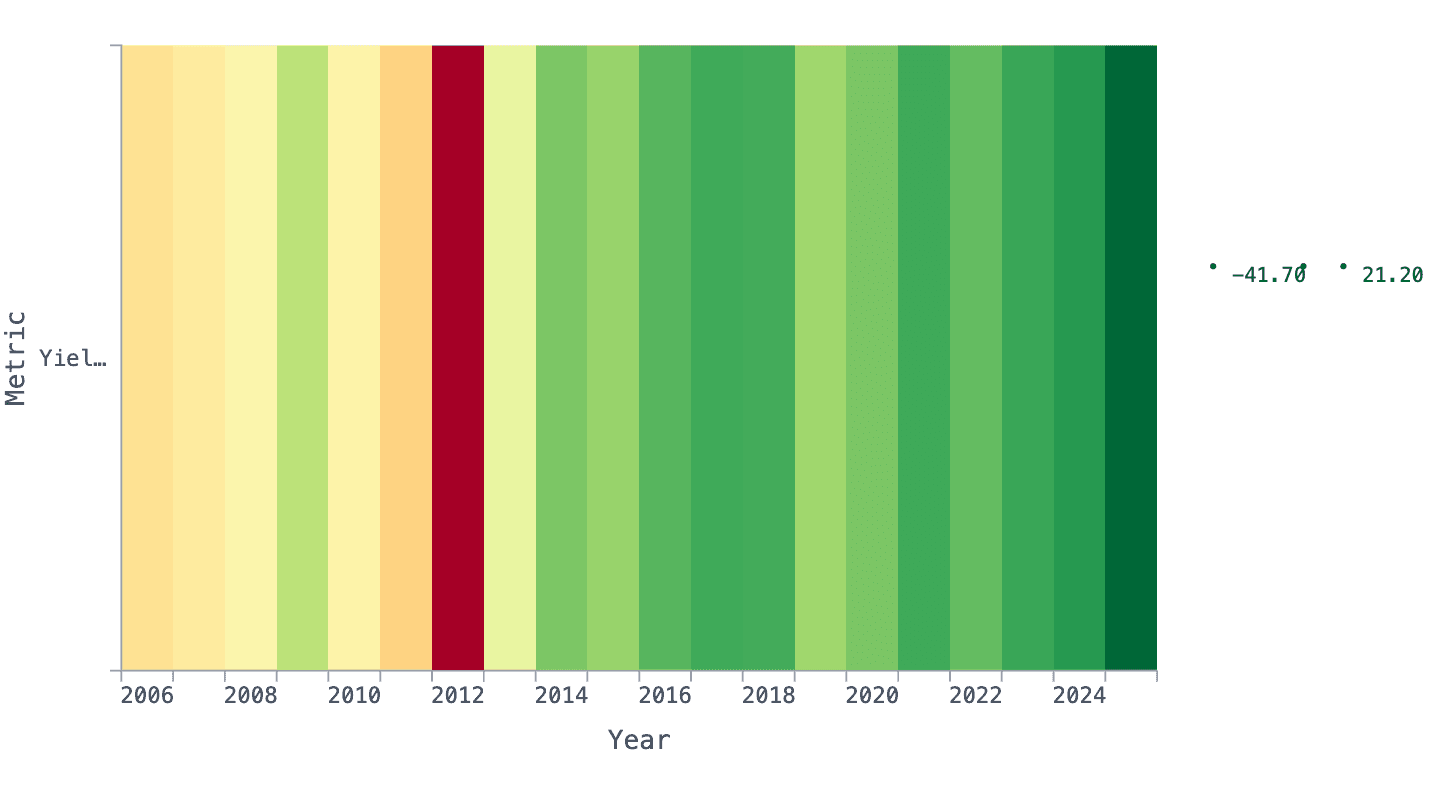
Yield Performance vs 20-Year Average (Heatmap)
Key Statistics
20-Year Historical Performance (2006-2025)
Metric | Value |
|---|---|
Average Yield | 164.8 bu/acre |
Standard Deviation | 15.1 bu/acre |
Lowest Year | 2012: 123.1 bu/acre (drought) |
Highest Year | 2025: 186.0 bu/acre (record) |
Trend Growth Rate | +1.94 bu/acre/year |
R-squared | 57.5% |
Residual Std Dev | 9.85 bu/acre |
5-Year Period Comparison
Period | Avg Yield | Min | Max | Std Dev |
|---|---|---|---|---|
2006-2010 | 154.0 | 149.1 | 164.4 | 6.0 |
2011-2015 | 153.5 | 123.1 | 171.0 | 19.5 |
2016-2020 | 173.3 | 167.5 | 176.6 | 3.9 |
2021-2025 | 178.5 | 173.4 | 186.0 | 4.7 |
2026 Proj | 185.2 | 175.3 | 195.0 | 9.85 |
Methodology
Yield Projection Model
Data Source: USDA NASS official corn yield estimates (2006-2025)
Model: Linear regression trend analysis
Trend Equation: Yield = 1.937 × Year - 3,739.0
Uncertainty: Residual standard deviation of 9.85 bu/acre
Price Projection Model
Baseline Price: CME December 2026 Corn Futures (ZCZ6) at $4.47/bu (as of Jan 14, 2026)
Elasticity Model: -0.4 price elasticity (price change % / yield change %)
Assumption: Inverse relationship between yield and price
Key Insights
Strong Upward Trend: Corn yields have increased by approximately 1.94 bushels per acre annually over the past 20 years, driven by improved genetics, precision agriculture, and farming practices.
Remarkable Improvement: Average yields increased from 154 bu/acre (2006-2010) to 178.5 bu/acre (2021-2025) — a +16% improvement in just 15 years.
Declining Volatility: The 5-year rolling standard deviation has decreased from ~19 bu/acre (2011-2015, drought-impacted) to ~4.7 bu/acre (2021-2025), indicating more stable yields.
2025 Was Exceptional: The 2025 yield of 186.0 bu/acre was a new record, exceeding the trend by 2.8 bu/acre.
2026 Projection Context: The projected 185.2 bu/acre would be slightly below 2025's record but still represents continued strong productivity and is well above the 20-year average.
Weather Risk Remains: The 2012 drought demonstrates that yields can deviate significantly from trend (-35 bu/acre below trend), representing a tail risk scenario.
Price Sensitivity: A ±1 standard deviation yield swing translates to approximately ±2.2% price movement, or about $0.10/bushel.
Risk Considerations
Downside Risks
Drought: Conditions similar to 2012 could push yields to 150-160 bu/acre range
La Niña: Potential for drier conditions in key growing regions
Input Costs: High fertilizer/seed costs could reduce optimal application rates
Upside Potential
Favorable Weather: Ideal growing conditions could push yields above 195 bu/acre
Technology Adoption: Continued precision agriculture improvements
Seed Genetics: New hybrid varieties with higher yield potential
Market Factors
Actual prices will also be influenced by:
Export demand (especially China)
Ethanol policy and mandates
Global supply conditions
Currency fluctuations
Ending stocks levels
Data Sources
USDA NASS Corn Yield Chart - Historical yield data (updated January 12, 2026)
USDA NASS Crop Production Reports - Official yield estimates
CME Group December 2026 Corn Futures (ZCZ6) - Current pricing data
USDA NASS Quick Stats - Historical data reference