Generated by Edge AI
🥛 DAIRY MARKET RISK DASHBOARD
As of February 4, 2026
📋 ILLUSTRATIVE EXAMPLE
The following dashboard is based on a hypothetical book with these positions:
Commodity | Volume | Target Price |
|---|---|---|
Cheese | 100K lbs/mo | $1.70/lb |
Butter | 50K lbs/mo | $2.60/lb |
Class III Milk | 5K cwt/mo | $17.70/cwt |
📊 EXECUTIVE SUMMARY
Metric | Value | Status |
Total Unhedged Exposure | $2,628,109 | ⚠️ SIGNIFICANT RISK |
Current vs Budget Variance | -13% to -38% | ✅ FAVORABLE |
Average Hedge Coverage | 37.5% | 🔴 ACTION NEEDED |
VaR (95% Confidence) | -$1,081K | ⚠️ MONITOR |
P&L Swing Range (±20%) | $1,051,243 | ⚠️ MATERIAL |
📈 EXECUTIVE DASHBOARD OVERVIEW
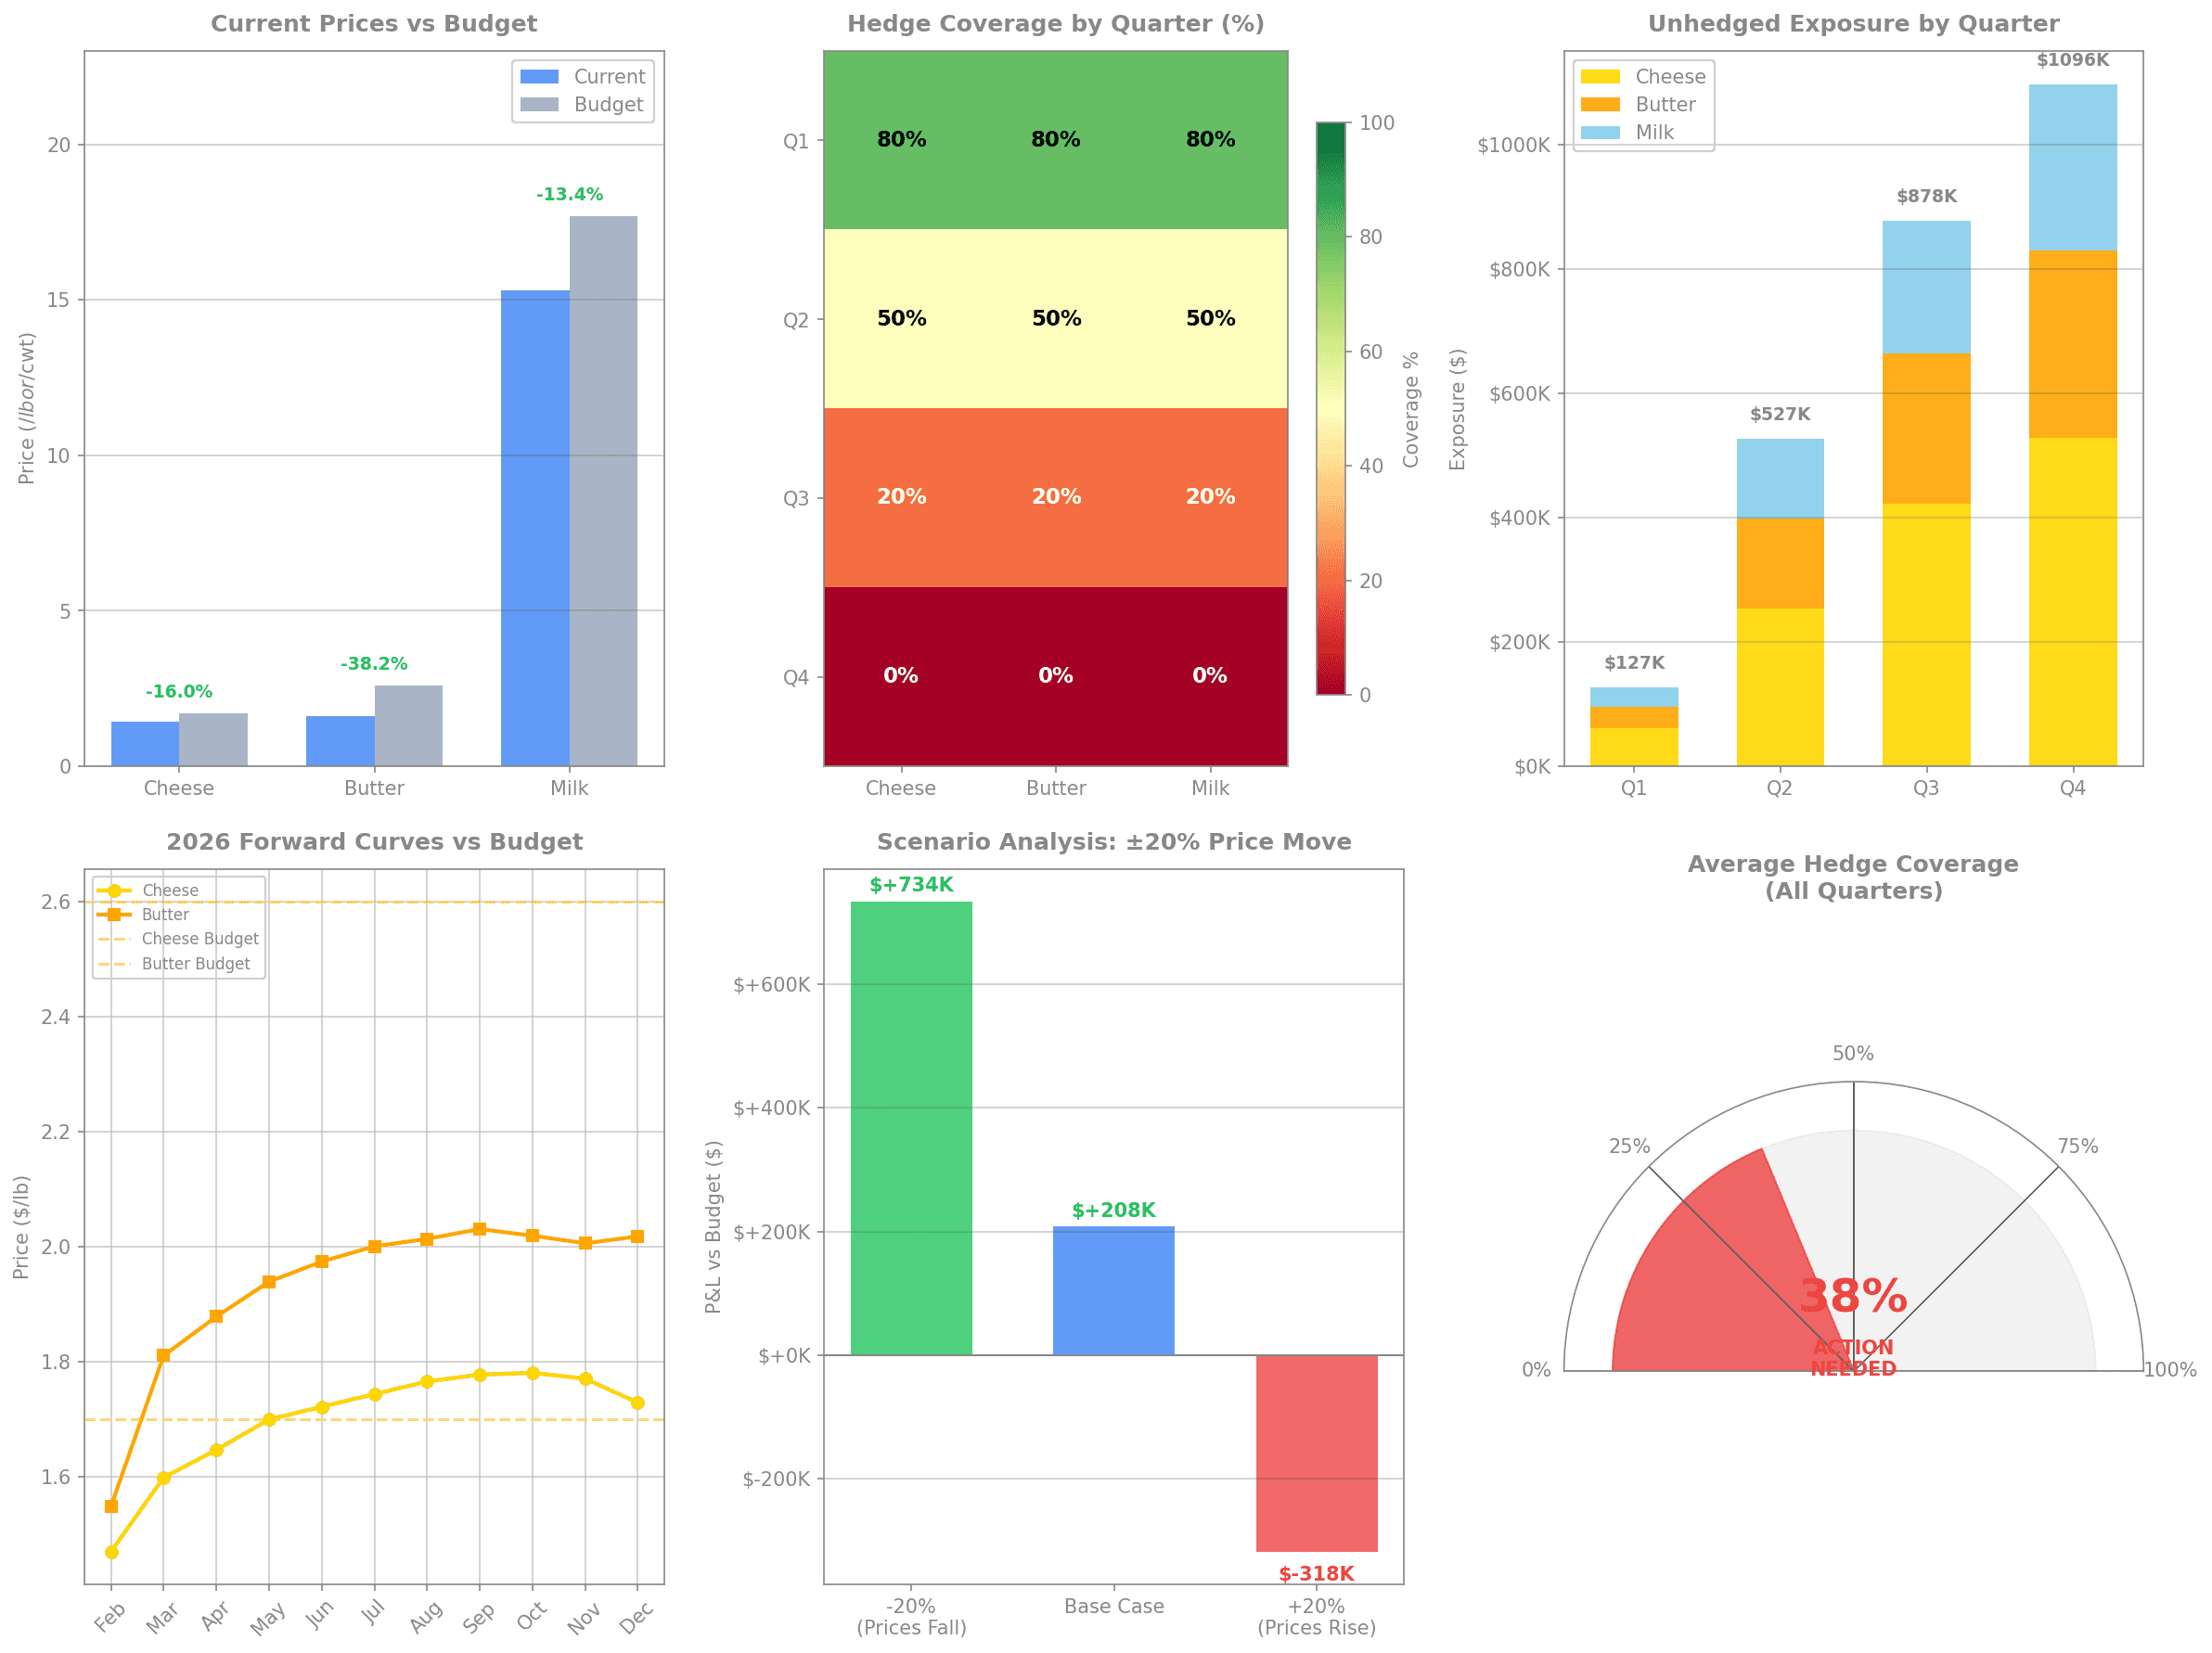
This 6-panel dashboard provides a comprehensive view of your dairy risk position:
Top Left: Current prices vs budget showing 13-38% favorable variance across all commodities
Top Center: Hedge coverage heatmap revealing critical gaps in Q3-Q4
Top Right: Stacked unhedged exposure building to $1.1M in Q4 alone
Bottom Left: Forward curves showing contango structure with prices rising toward budget
Bottom Center: Scenario analysis showing +$734K upside vs -$318K downside
Bottom Right: Gauge showing 37.5% average coverage - well below 70% target
1️⃣ CURRENT PRICES VS BUDGET ASSUMPTIONS
Price Comparison Summary
Commodity | Current Spot | Budget | Variance | Variance % | Status |
Cheese (40lb Blocks) | $1.4275/lb | $1.70/lb | -$0.2725 | -16.0% | ✅ FAVORABLE |
Butter | $1.6075/lb | $2.60/lb | -$0.9925 | -38.2% | ✅ FAVORABLE |
Class III Milk | $15.32/cwt | $17.70/cwt | -$2.38 | -13.4% | ✅ FAVORABLE |
12-Month Historical Context
Commodity | 12-Month Low | 12-Month High | Current | Percentile |
Cheese | $1.2825/lb | $1.9550/lb | $1.4275/lb | 22nd |
Butter | $1.3000/lb | $2.6200/lb | $1.6075/lb | 23rd |
Key Insight: Current prices are in the lower quartile of the 12-month range, representing an exceptional buying opportunity. Butter in particular is trading near its 12-month lows after collapsing 50% from the July 2025 peak.
📈 HISTORICAL VOLATILITY & BOLLINGER BANDS ANALYSIS
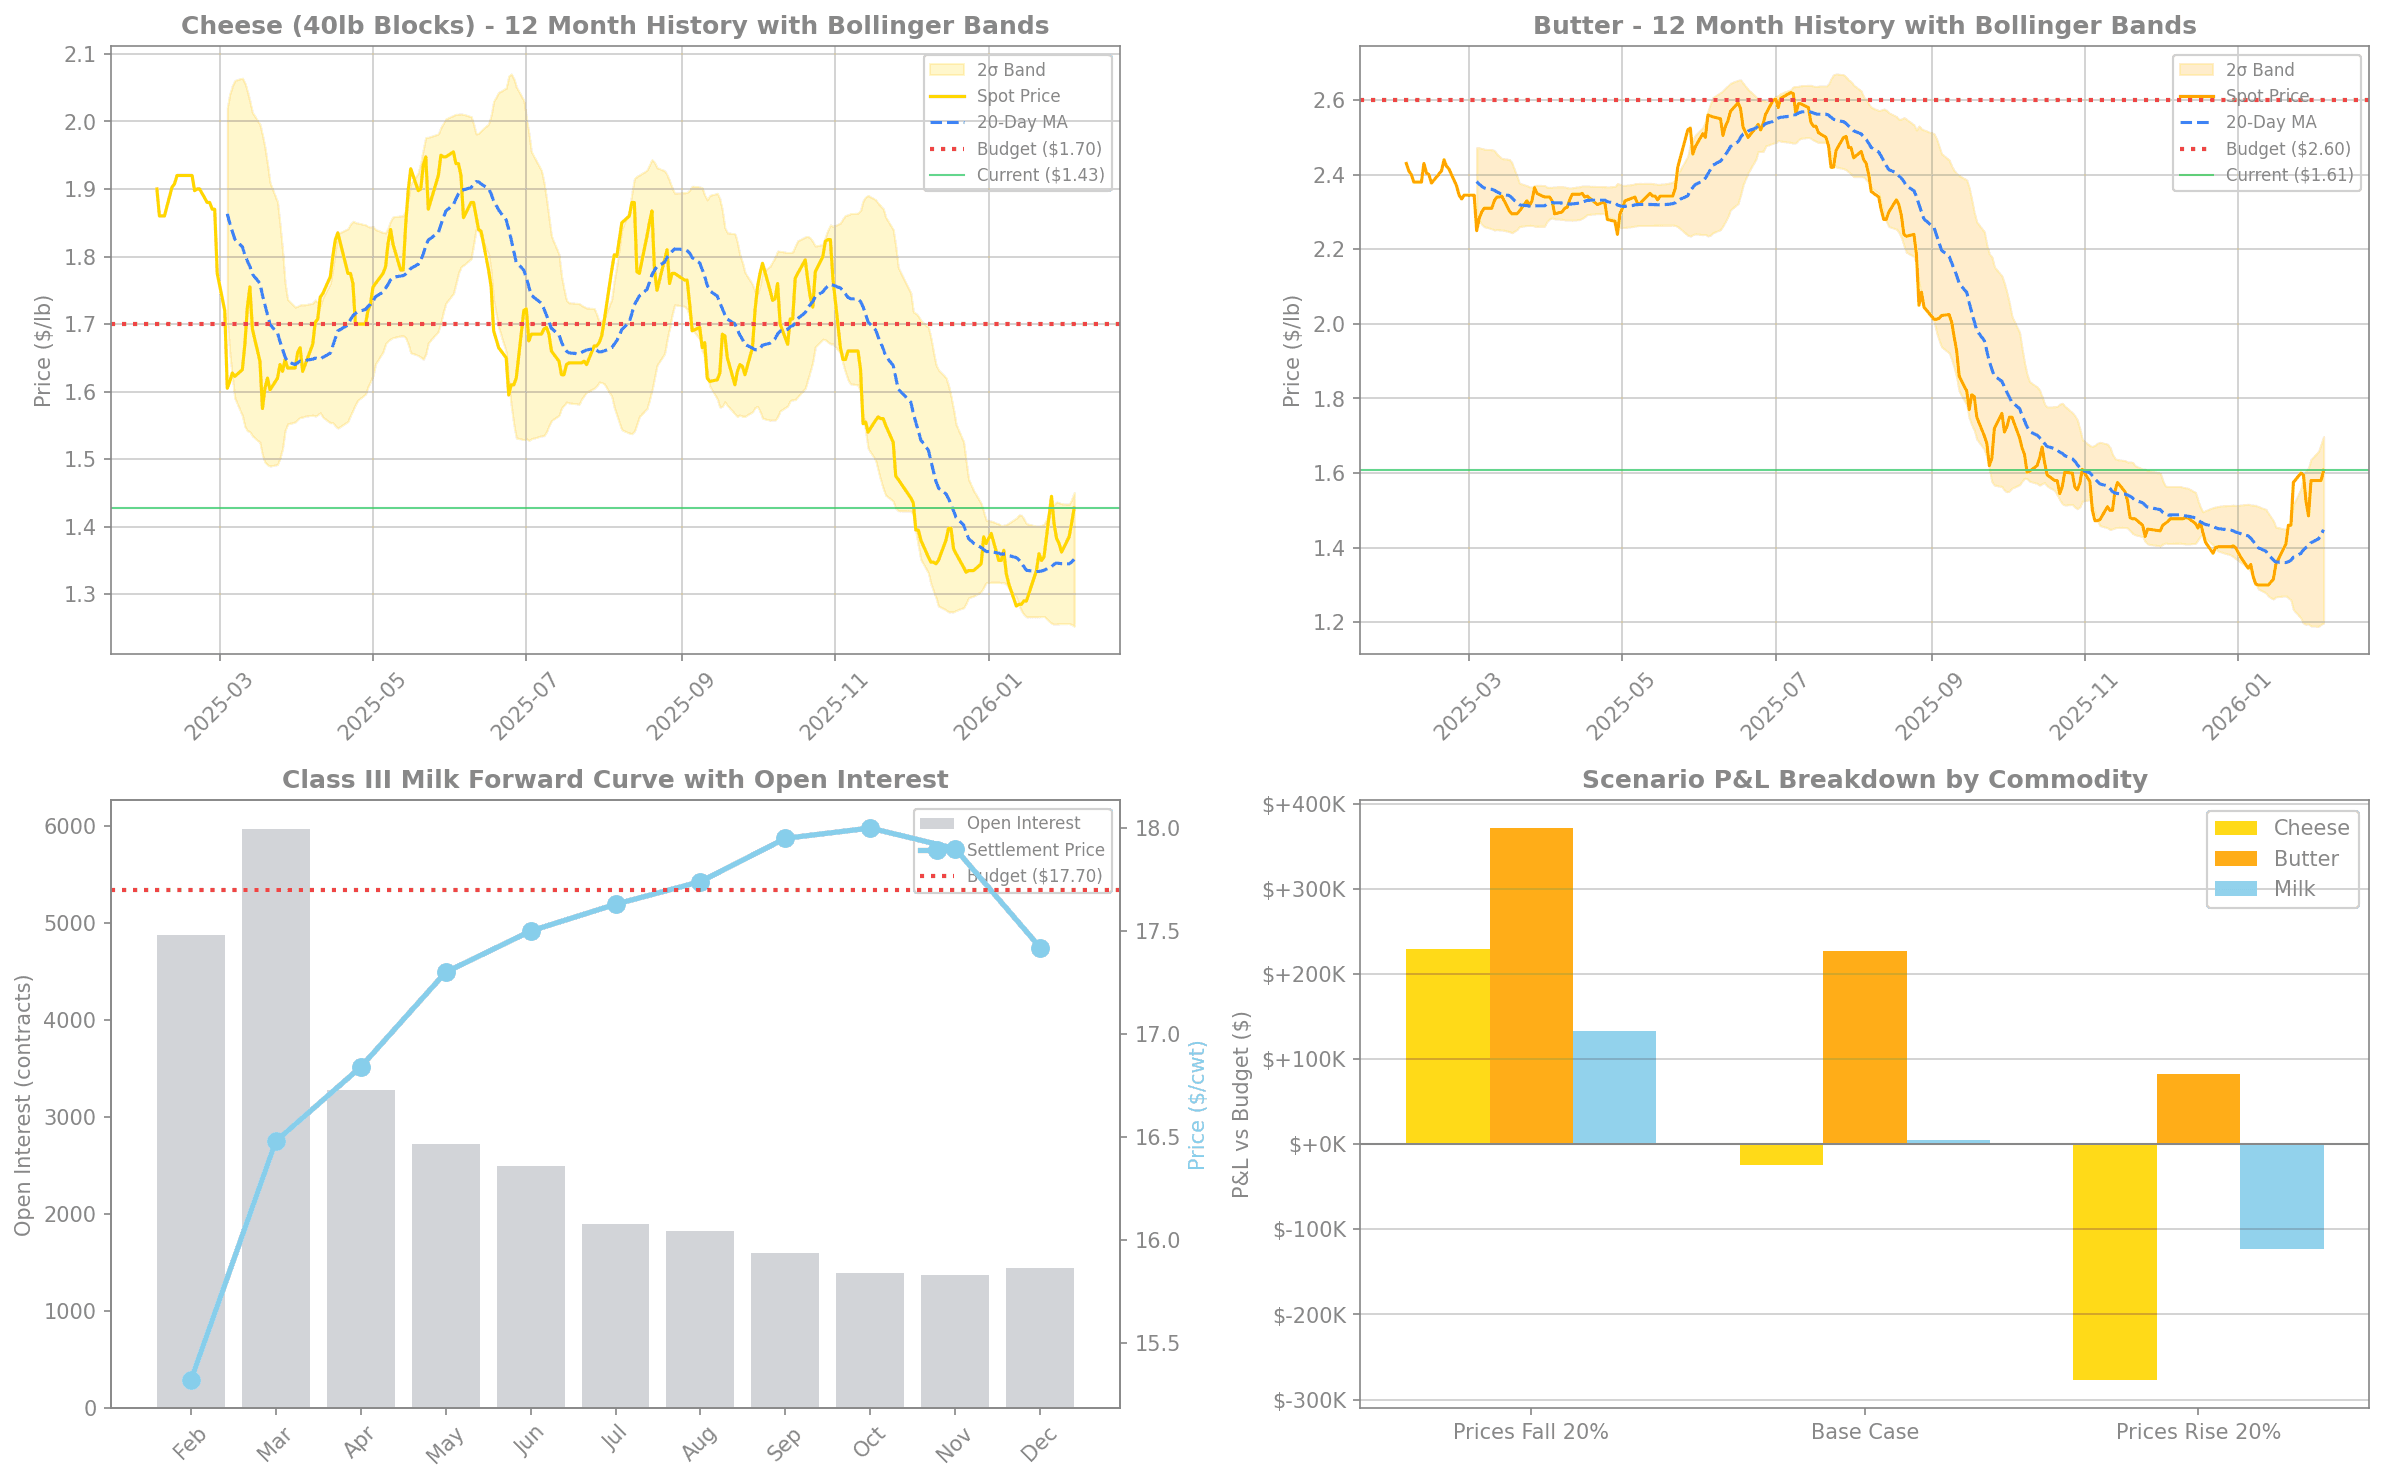
This 4-panel analysis shows:
Top Left: Cheese 12-month price history with Bollinger Bands showing current price below the 20-day moving average
Top Right: Butter volatility analysis showing the dramatic collapse from $2.62 to $1.30 and subsequent recovery
Bottom Left: Class III Milk forward curve with open interest overlay showing liquidity concentration in near months
Bottom Right: Scenario P&L breakdown by commodity showing butter provides the largest favorable variance
Volatility Metrics
Commodity | 20-Day Volatility | Annualized Vol | Current vs MA20 |
Cheese | 2.8% | ~18% | Below MA |
Butter | 4.2% | ~27% | Above MA (recovering) |
2️⃣ HEDGE COVERAGE BY QUARTER
Coverage Matrix
Quarter | Cheese | Butter | Class III Milk | Overall | Status |
Q1 2026 | 80% | 80% | 80% | 80% | ✅ ADEQUATE |
Q2 2026 | 50% | 50% | 50% | 50% | ⚠️ NEEDS ATTENTION |
Q3 2026 | 20% | 20% | 20% | 20% | 🔴 UNDERHEDGED |
Q4 2026 | 0% | 0% | 0% | 0% | 🔴 UNHEDGED |
Coverage Progression
Metric | Current | Target | Gap |
Q1 Coverage | 80% | 80% | ✅ Met |
Q2 Coverage | 50% | 70% | -20% |
Q3 Coverage | 20% | 60% | -40% |
Q4 Coverage | 0% | 50% | -50% |
Average | 37.5% | 65% | -27.5% |
3️⃣ UNHEDGED EXPOSURE IN DOLLAR TERMS
Quarterly Exposure Breakdown
Quarter | Cheese | Butter | Milk | Total | % of Annual |
Q1 2026 | $61,340 | $33,575 | $31,800 | $126,715 | 4.8% |
Q2 2026 | $253,300 | $144,744 | $129,100 | $527,144 | 20.1% |
Q3 2026 | $422,800 | $241,720 | $213,280 | $877,800 | 33.4% |
Q4 2026 | $527,800 | $302,050 | $266,600 | $1,096,450 | 41.7% |
TOTAL | $1,265,240 | $722,089 | $640,780 | $2,628,109 | 100% |
Exposure by Commodity
Commodity | Unhedged Exposure | % of Total | Risk Priority |
Cheese | $1,265,240 | 48.1% | 🔴 HIGH |
Butter | $722,089 | 27.5% | 🟡 MEDIUM |
Class III Milk | $640,780 | 24.4% | 🟡 MEDIUM |
📈 RISK EVENTS TIMELINE & EXPOSURE WATERFALL
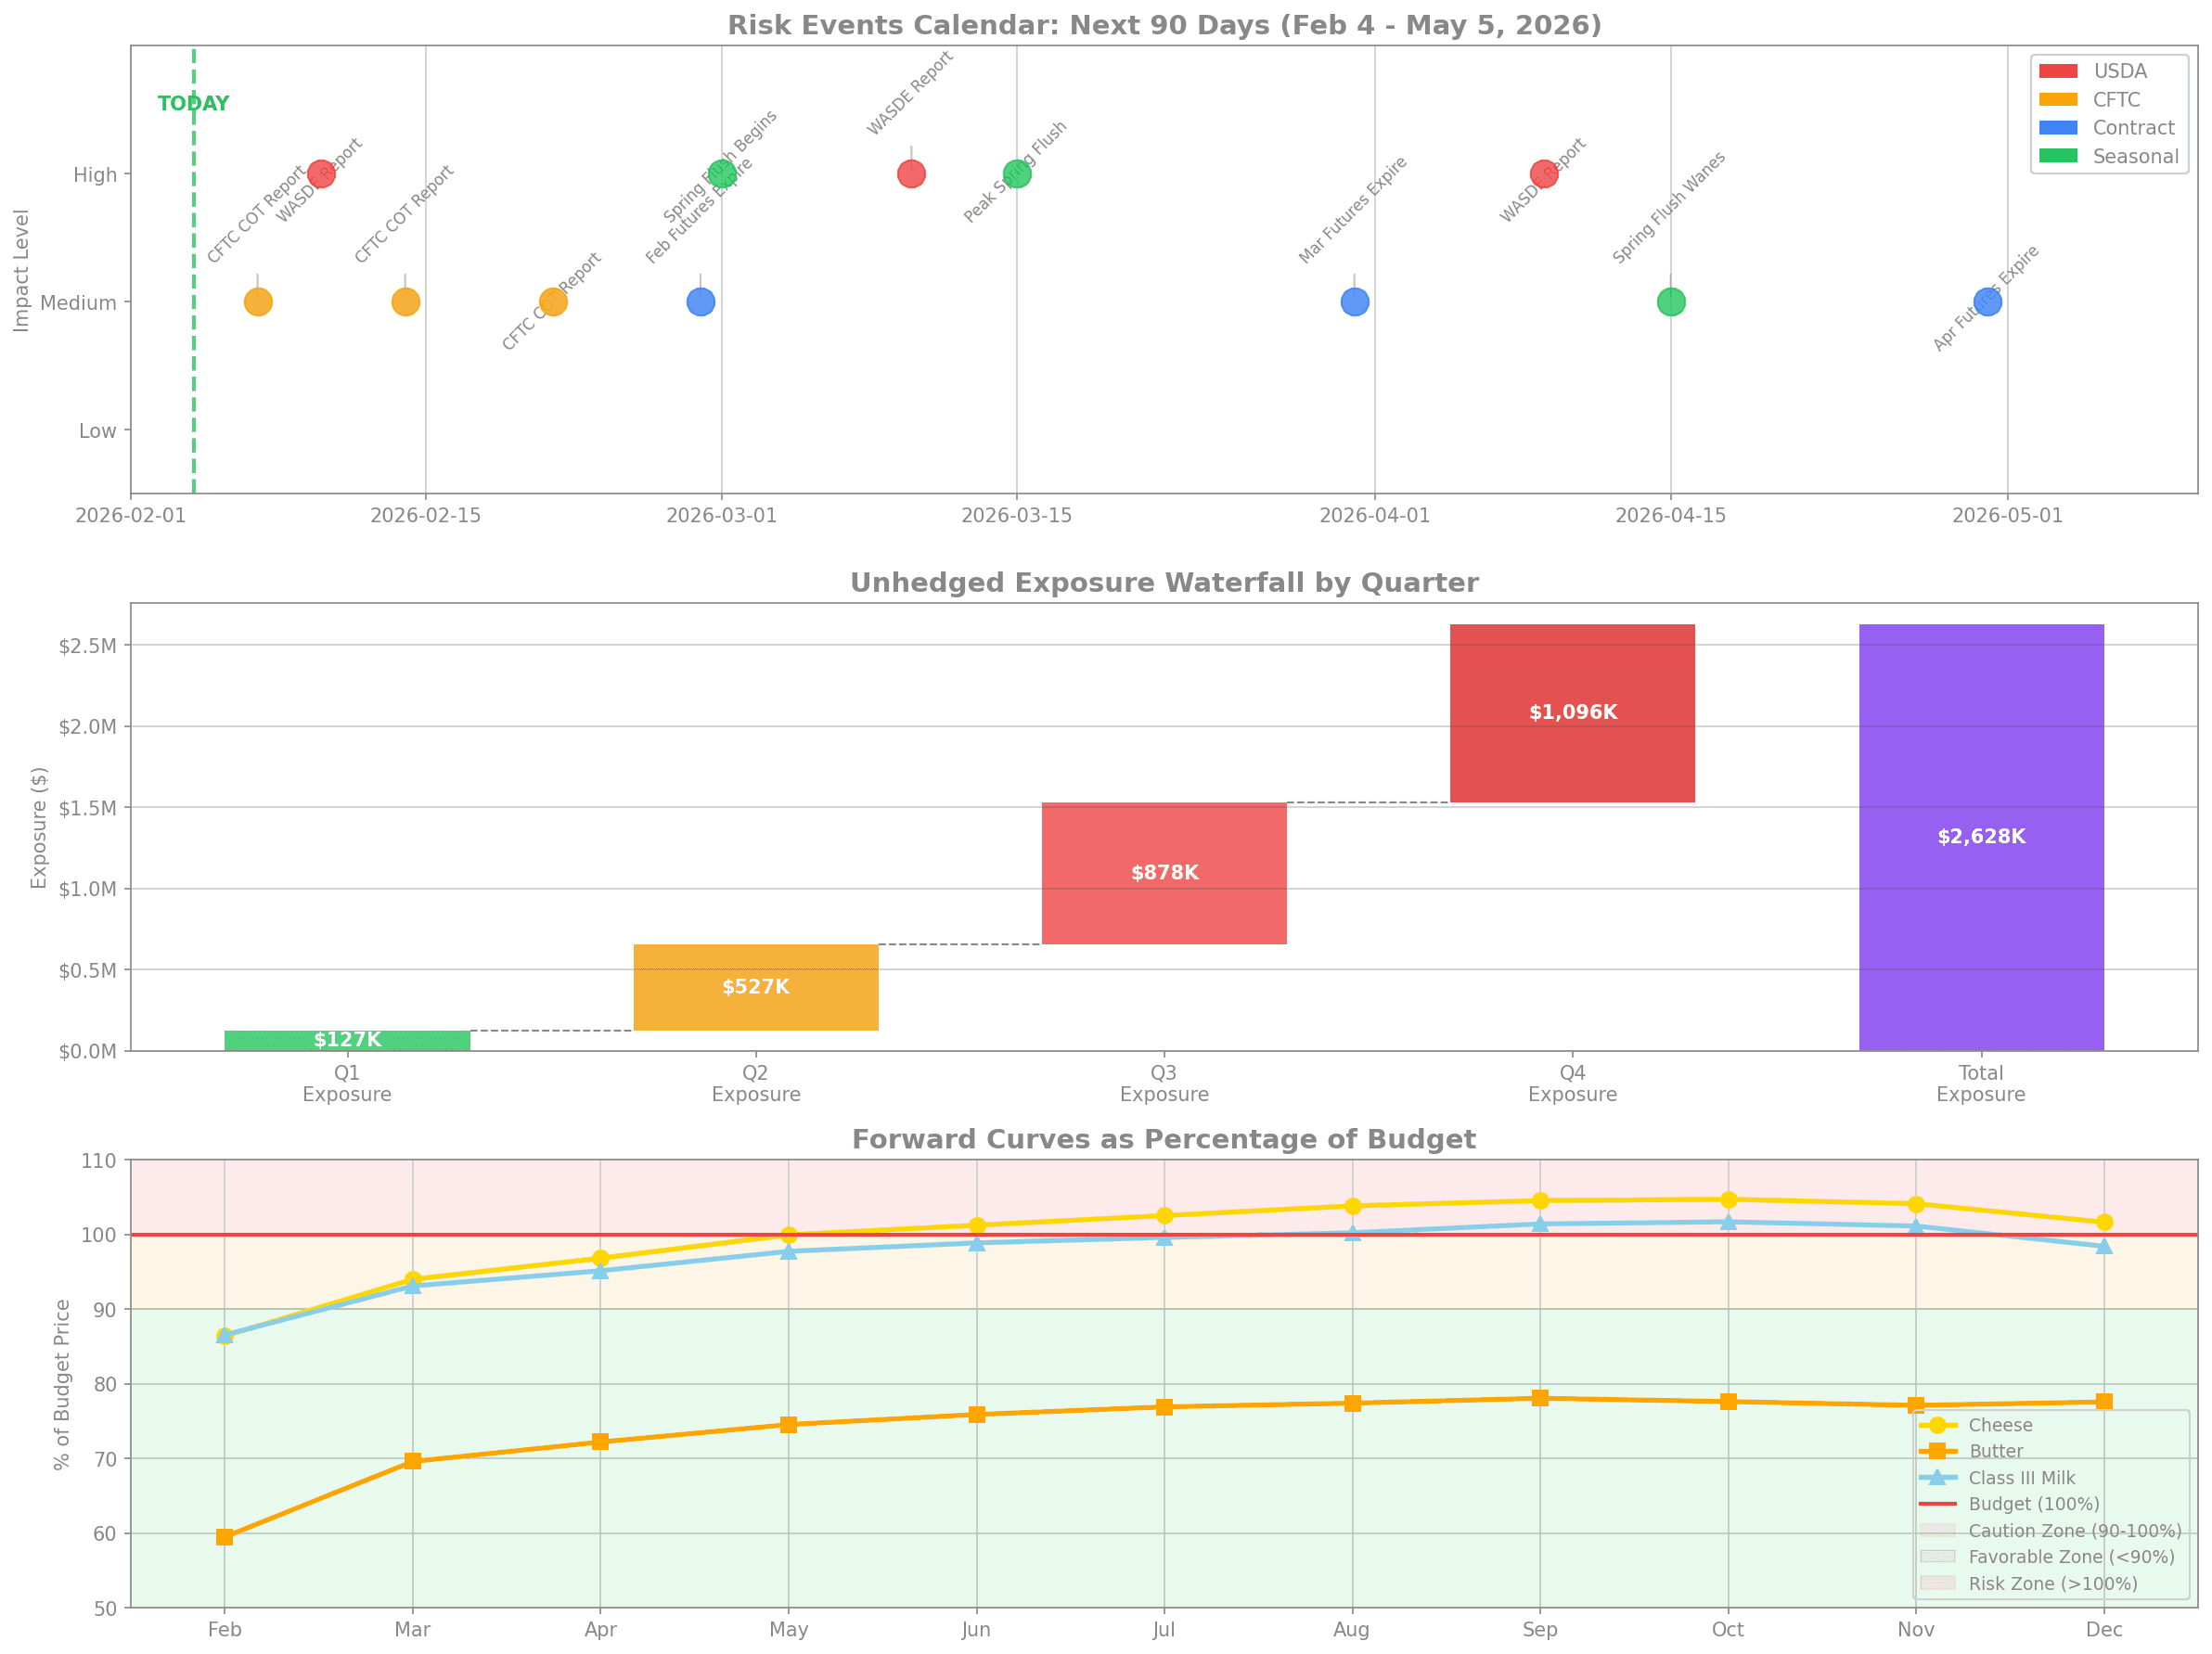
This 3-panel analysis shows:
Top: Risk events calendar for next 90 days with WASDE reports (red), CFTC reports (orange), contract expirations (blue), and seasonal patterns (green)
Middle: Exposure waterfall showing cumulative build from $127K in Q1 to $2.63M total
Bottom: Forward curves as percentage of budget - all commodities trading in the "favorable zone" below 100%
4️⃣ KEY RISK EVENTS (NEXT 90 DAYS)
📅 Critical Dates: February 4 - May 5, 2026
Date | Event | Category | Impact | Action Required |
Feb 7 | CFTC COT Report | Positioning | 🟡 MEDIUM | Monitor managed money flows |
Feb 10 | WASDE Report | USDA | 🔴 HIGH | Key dairy supply/demand update |
Feb 28 | Feb Futures Expire | Contract | 🟡 MEDIUM | Roll or close DCG6, CSCG6, CBG6 |
Mar 1 | Spring Flush Begins | Seasonal | 🔴 HIGH | Prepare for price weakness |
Mar 10 | WASDE Report | USDA | 🔴 HIGH | Updated production forecasts |
Mar 15 | Peak Spring Flush | Seasonal | 🔴 HIGH | Optimal Q3-Q4 entry window |
Mar 31 | Mar Futures Expire | Contract | 🟡 MEDIUM | Roll or close DCH6, CSCH6, CBH6 |
Apr 9 | WASDE Report | USDA | 🔴 HIGH | Spring production data |
Apr 15 | Spring Flush Wanes | Seasonal | 🟡 MEDIUM | Prices may stabilize |
Apr 30 | Apr Futures Expire | Contract | 🟡 MEDIUM | Roll or close DCJ6, CSCJ6, CBJ6 |
🌸 Seasonal Pattern: Spring Flush
The spring flush (March-April) is the most important seasonal factor for dairy markets:
Phase | Timing | Impact | Strategy |
Early Flush | Mar 1-15 | Milk production ↑ 3-5% | Begin scaling into Q3 positions |
Peak Flush | Mar 15-Apr 15 | Maximum production, prices soften | Aggressive Q3-Q4 coverage |
Late Flush | Apr 15-30 | Production normalizes | Complete coverage targets |
📈 TERM STRUCTURE & CORRELATION ANALYSIS
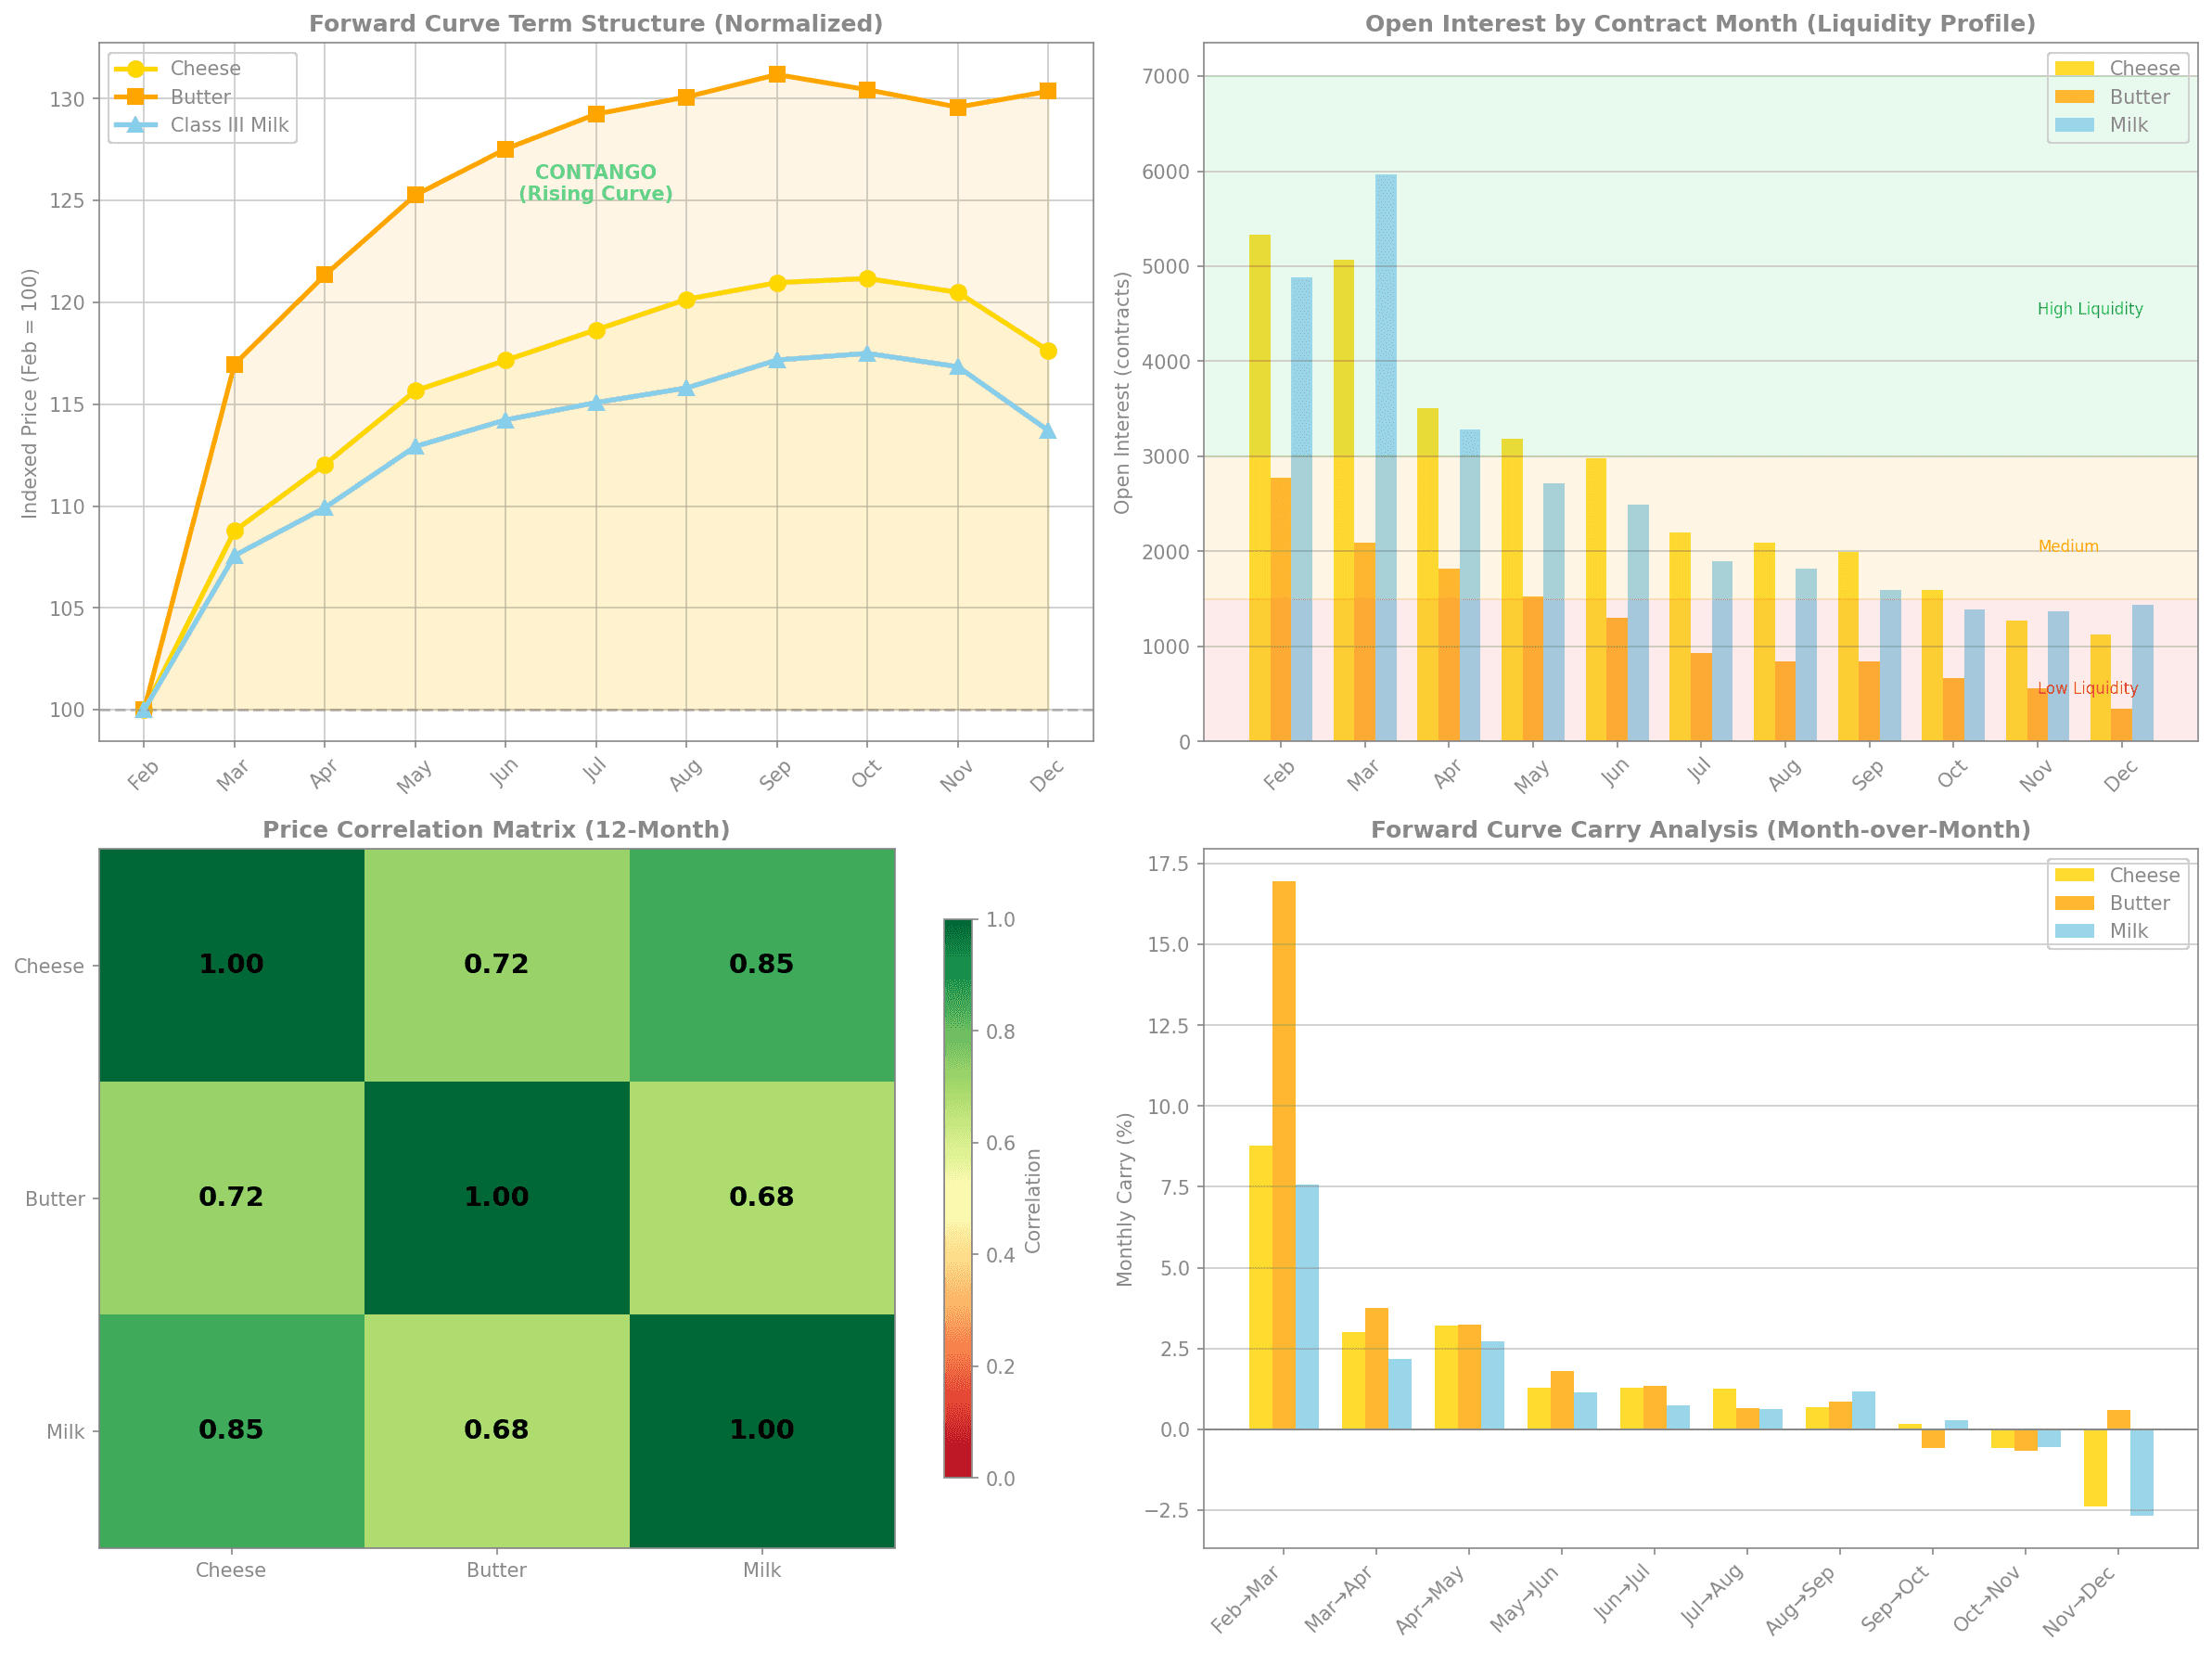
This 4-panel analysis shows:
Top Left: Normalized forward curves showing all commodities in contango (17-31% above spot by year-end)
Top Right: Open interest by contract month with liquidity zones - front months have best liquidity
Bottom Left: Price correlation matrix showing cheese-milk correlation of 0.85 and cheese-butter of 0.72
Bottom Right: Monthly carry analysis showing highest roll cost in Feb→Mar transition
Forward Curve Analysis
Commodity | Feb 2026 | Jun 2026 | Dec 2026 | Contango % |
Cheese | $1.469 | $1.721 | $1.728 | +17.6% |
Butter | $1.548 | $1.974 | $2.017 | +30.4% |
Class III Milk | $15.32 | $17.50 | $17.42 | +13.7% |
Key Insight: The steep contango structure means waiting to hedge costs money. Each month of delay adds 2-5% to forward prices.
5️⃣ SCENARIO ANALYSIS: ±20% PRICE MOVE
Scenario Price Levels
Commodity | -20% Scenario | Base Case | +20% Scenario |
Cheese | $1.142/lb | $1.428/lb | $1.713/lb |
Butter | $1.286/lb | $1.608/lb | $1.929/lb |
Class III Milk | $12.26/cwt | $15.32/cwt | $18.38/cwt |
P&L Impact Analysis
Scenario | Cheese P&L | Butter P&L | Milk P&L | Total P&L |
-20% (Prices Fall) | +$228,808 | +$371,329 | +$133,426 | +$733,563 |
Base Case | -$24,240 | +$226,911 | +$5,270 | +$207,941 |
+20% (Prices Rise) | -$277,288 | +$82,494 | -$122,886 | -$317,680 |
📈 ADVANCED SCENARIO & VAR ANALYSIS
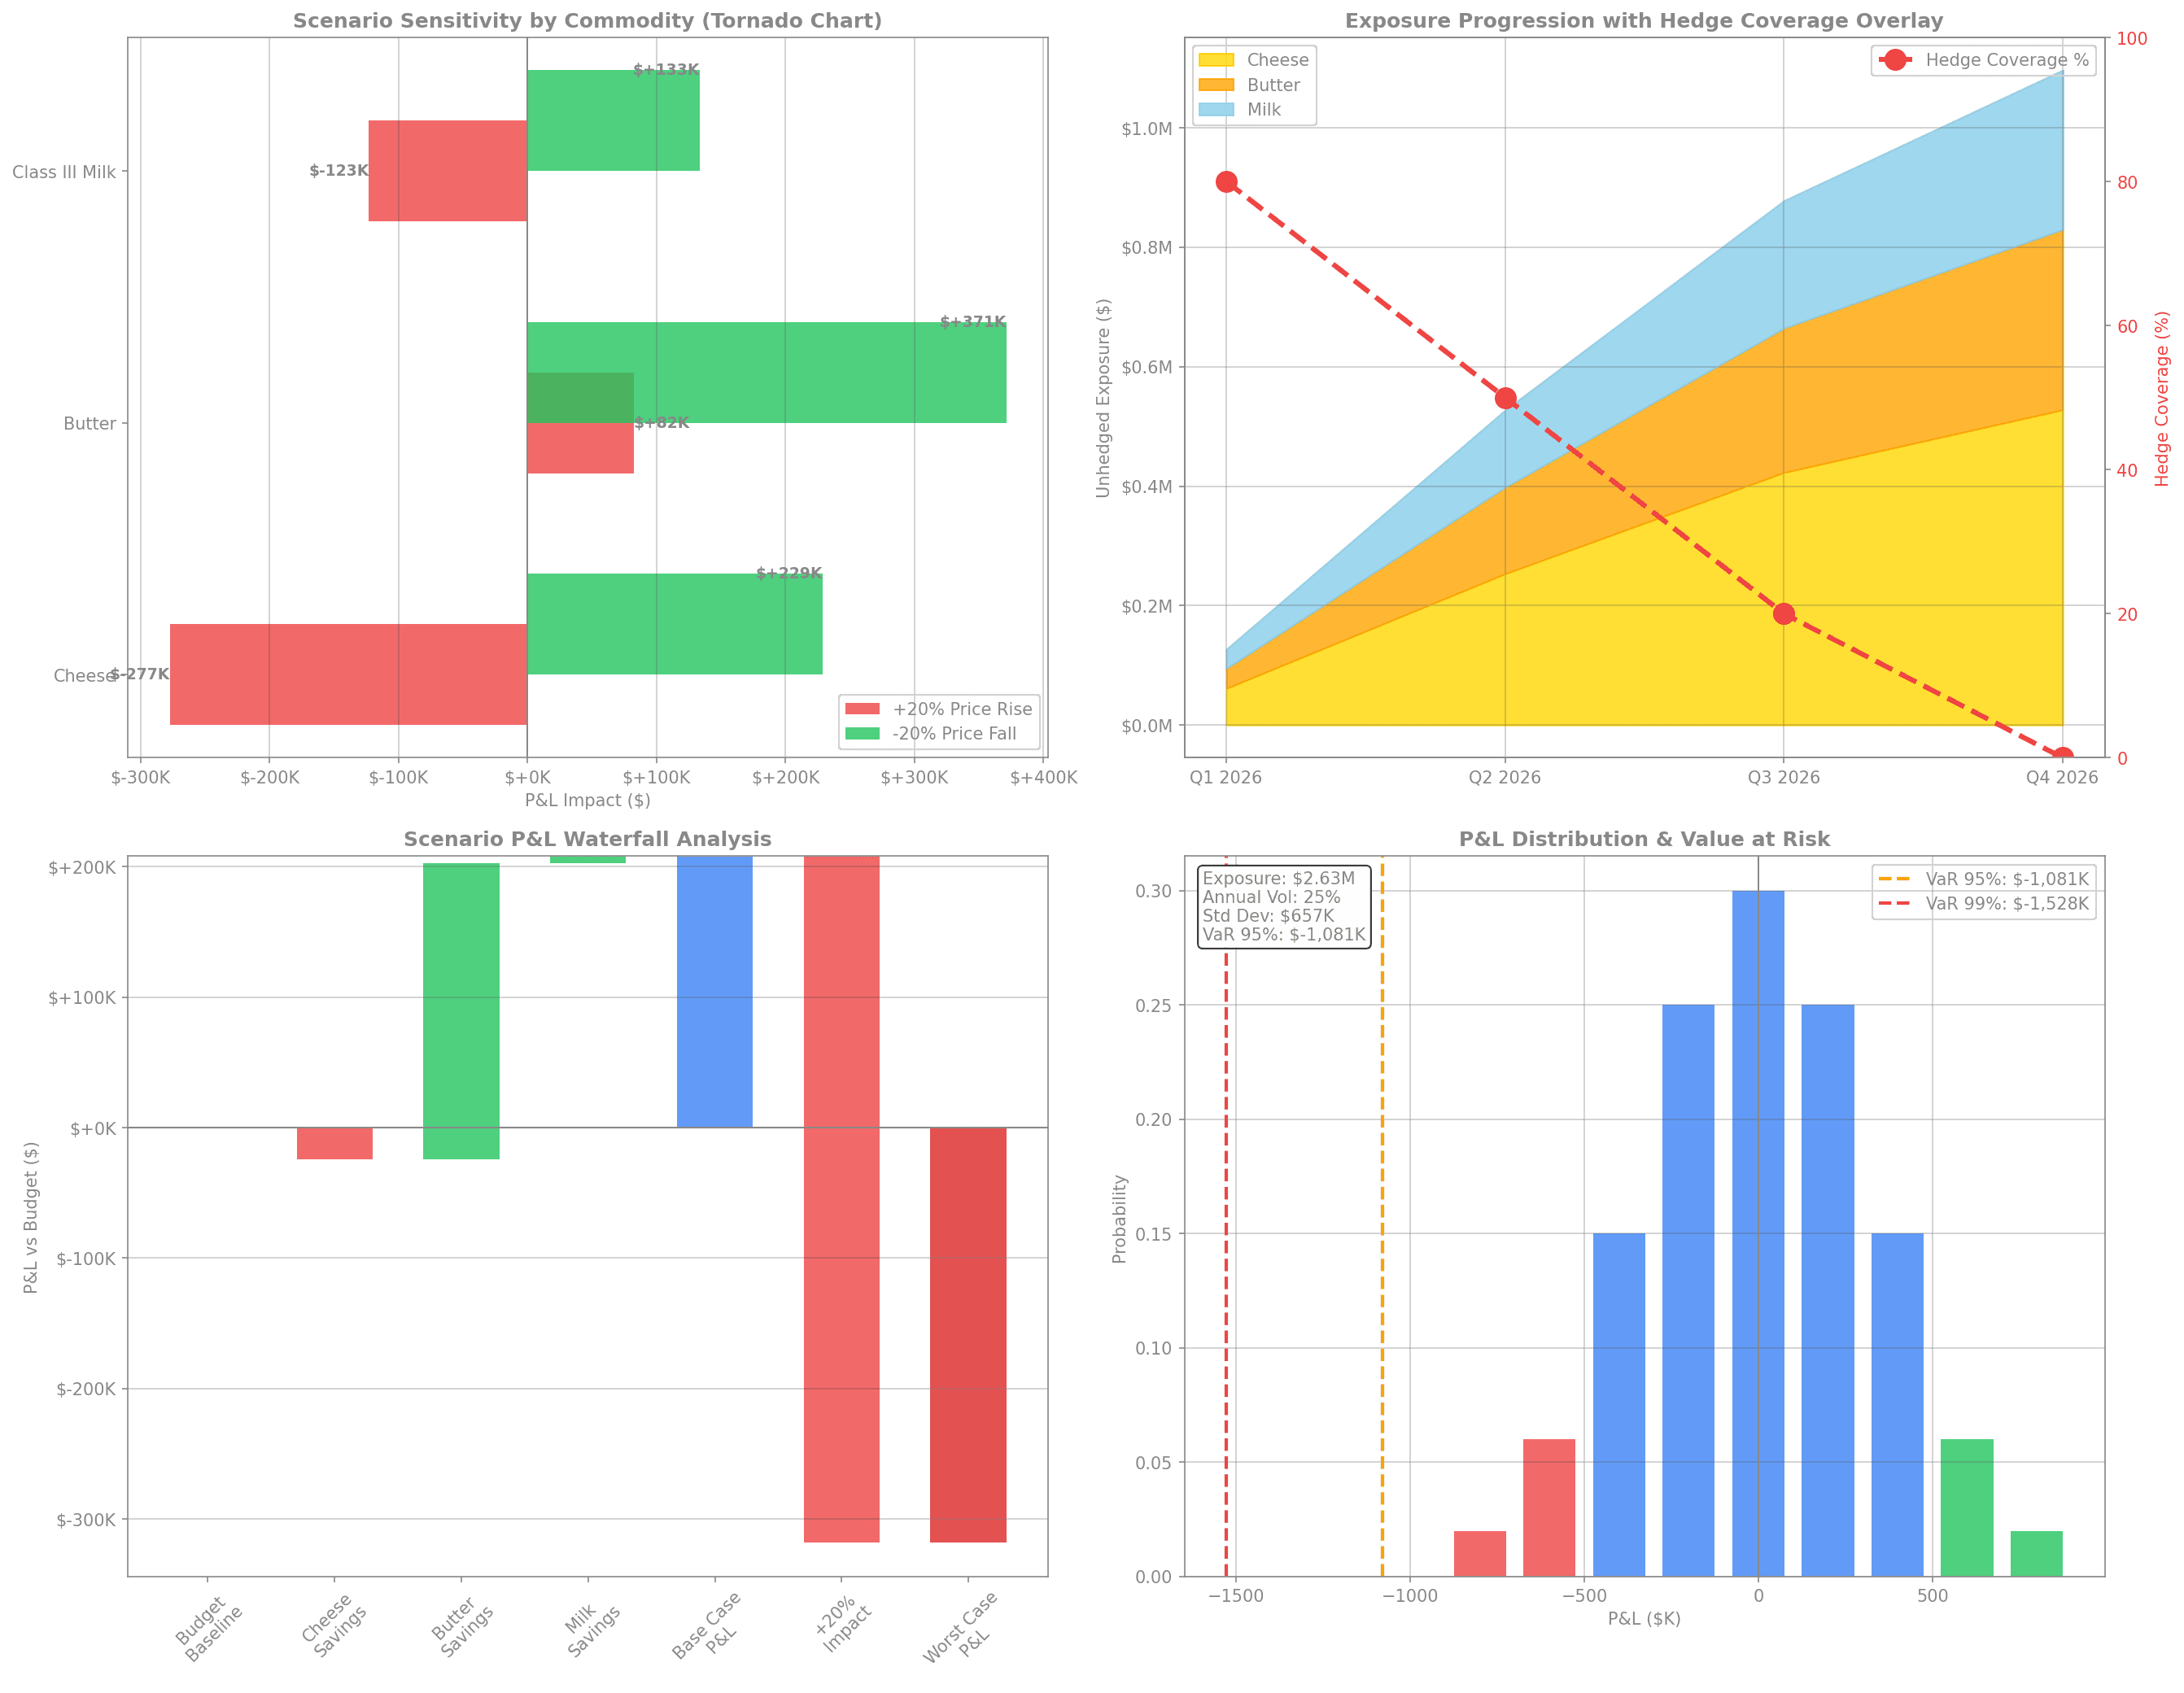
This 4-panel analysis shows:
Top Left: Tornado chart showing sensitivity by commodity - butter provides largest favorable variance, cheese has highest downside risk
Top Right: Stacked area exposure progression with hedge coverage overlay showing inverse relationship
Bottom Left: P&L waterfall from budget baseline through scenario impacts
Bottom Right: P&L distribution with VaR analysis showing 95% VaR of -$1,081K
Value at Risk Summary
Metric | Value | Interpretation |
Total Exposure | $2,628,109 | Unhedged commodity value |
Annual Volatility | ~25% | Based on historical price moves |
VaR (95%) | -$1,081,000 | 5% chance of loss exceeding this |
VaR (99%) | -$1,528,000 | 1% chance of loss exceeding this |
Expected Shortfall | -$1,350,000 | Average loss in worst 5% of scenarios |
🎯 STRATEGIC RECOMMENDATIONS
Immediate Actions (This Week)
Priority | Action | Rationale | Expected Benefit |
🔴 1 | Execute 30% Q2 futures coverage | Lock in below-budget prices | ~$50K savings vs budget |
🔴 2 | Set limit orders for Q3-Q4 | Automate spring flush entries | Capture seasonal weakness |
🟡 3 | Review Feb 10 WASDE preview | Prepare for volatility | Risk management |
Short-Term (Feb 10 - Mar 15)
Priority | Action | Target |
🔴 1 | Complete Q2 coverage to 80% | Reduce Q2 exposure by $263K |
🟡 2 | Begin Q3 scaling during flush | Q3: 20% → 40% |
🟡 3 | Evaluate call options for Q4 | Cap upside risk |
Medium-Term (Mar 15 - Apr 30)
Priority | Action | Target |
🔴 1 | Aggressive Q3-Q4 coverage | Q3: 40% → 70%, Q4: 0% → 50% |
🟡 2 | Consider collar structures | Zero-cost protection |
🟡 3 | Monitor cold storage reports | Adjust commodity mix |
📊 RECOMMENDED HEDGE EXECUTION PLAN
Target Coverage by Quarter
Quarter | Current | Target | Gap to Fill | Contracts Needed |
Q2 2026 | 50% | 80% | 30% | ~45 cheese, ~23 butter, ~23 milk |
Q3 2026 | 20% | 70% | 50% | ~75 cheese, ~38 butter, ~38 milk |
Q4 2026 | 0% | 50% | 50% | ~75 cheese, ~38 butter, ~38 milk |
Execution Timeline
Week | Action | Cumulative Coverage |
Feb 4-7 | Execute 30% Q2 coverage | Q2: 80% |
Feb 17-28 | Begin Q3 scaling | Q3: 30% |
Mar 3-14 | Continue Q3, start Q4 | Q3: 45%, Q4: 15% |
Mar 17-31 | Peak flush buying | Q3: 60%, Q4: 35% |
Apr 1-15 | Complete targets | Q3: 70%, Q4: 50% |
📋 KEY TAKEAWAYS
Favorable Price Environment: Current prices are 13-38% below budget, representing significant savings opportunity
Contango Risk: Forward curves are rising 14-30% from spot to year-end - delaying hedges costs money
Coverage Gap: Average hedge coverage of 37.5% is well below the 65% target, leaving $2.63M exposed
Spring Flush Opportunity: March-April seasonal weakness provides optimal entry window for Q3-Q4 coverage
Asymmetric Risk: Downside scenario (+$734K) outweighs upside risk (-$318K) due to favorable budget variance
VaR Alert: 95% VaR of -$1.08M warrants immediate action to reduce unhedged exposure
Dashboard Generated: February 4, 2026 | Data as of February 3, 2026
Sources: CME Group (settlement prices), USDA AMS (spot prices), USDA NASS (production data)