
Generated by Edge AI
Palm Oil: Corrected Five-Year Supply, Demand & Price Outlook
Report Date: January 15, 2026
Executive Summary
Key Findings
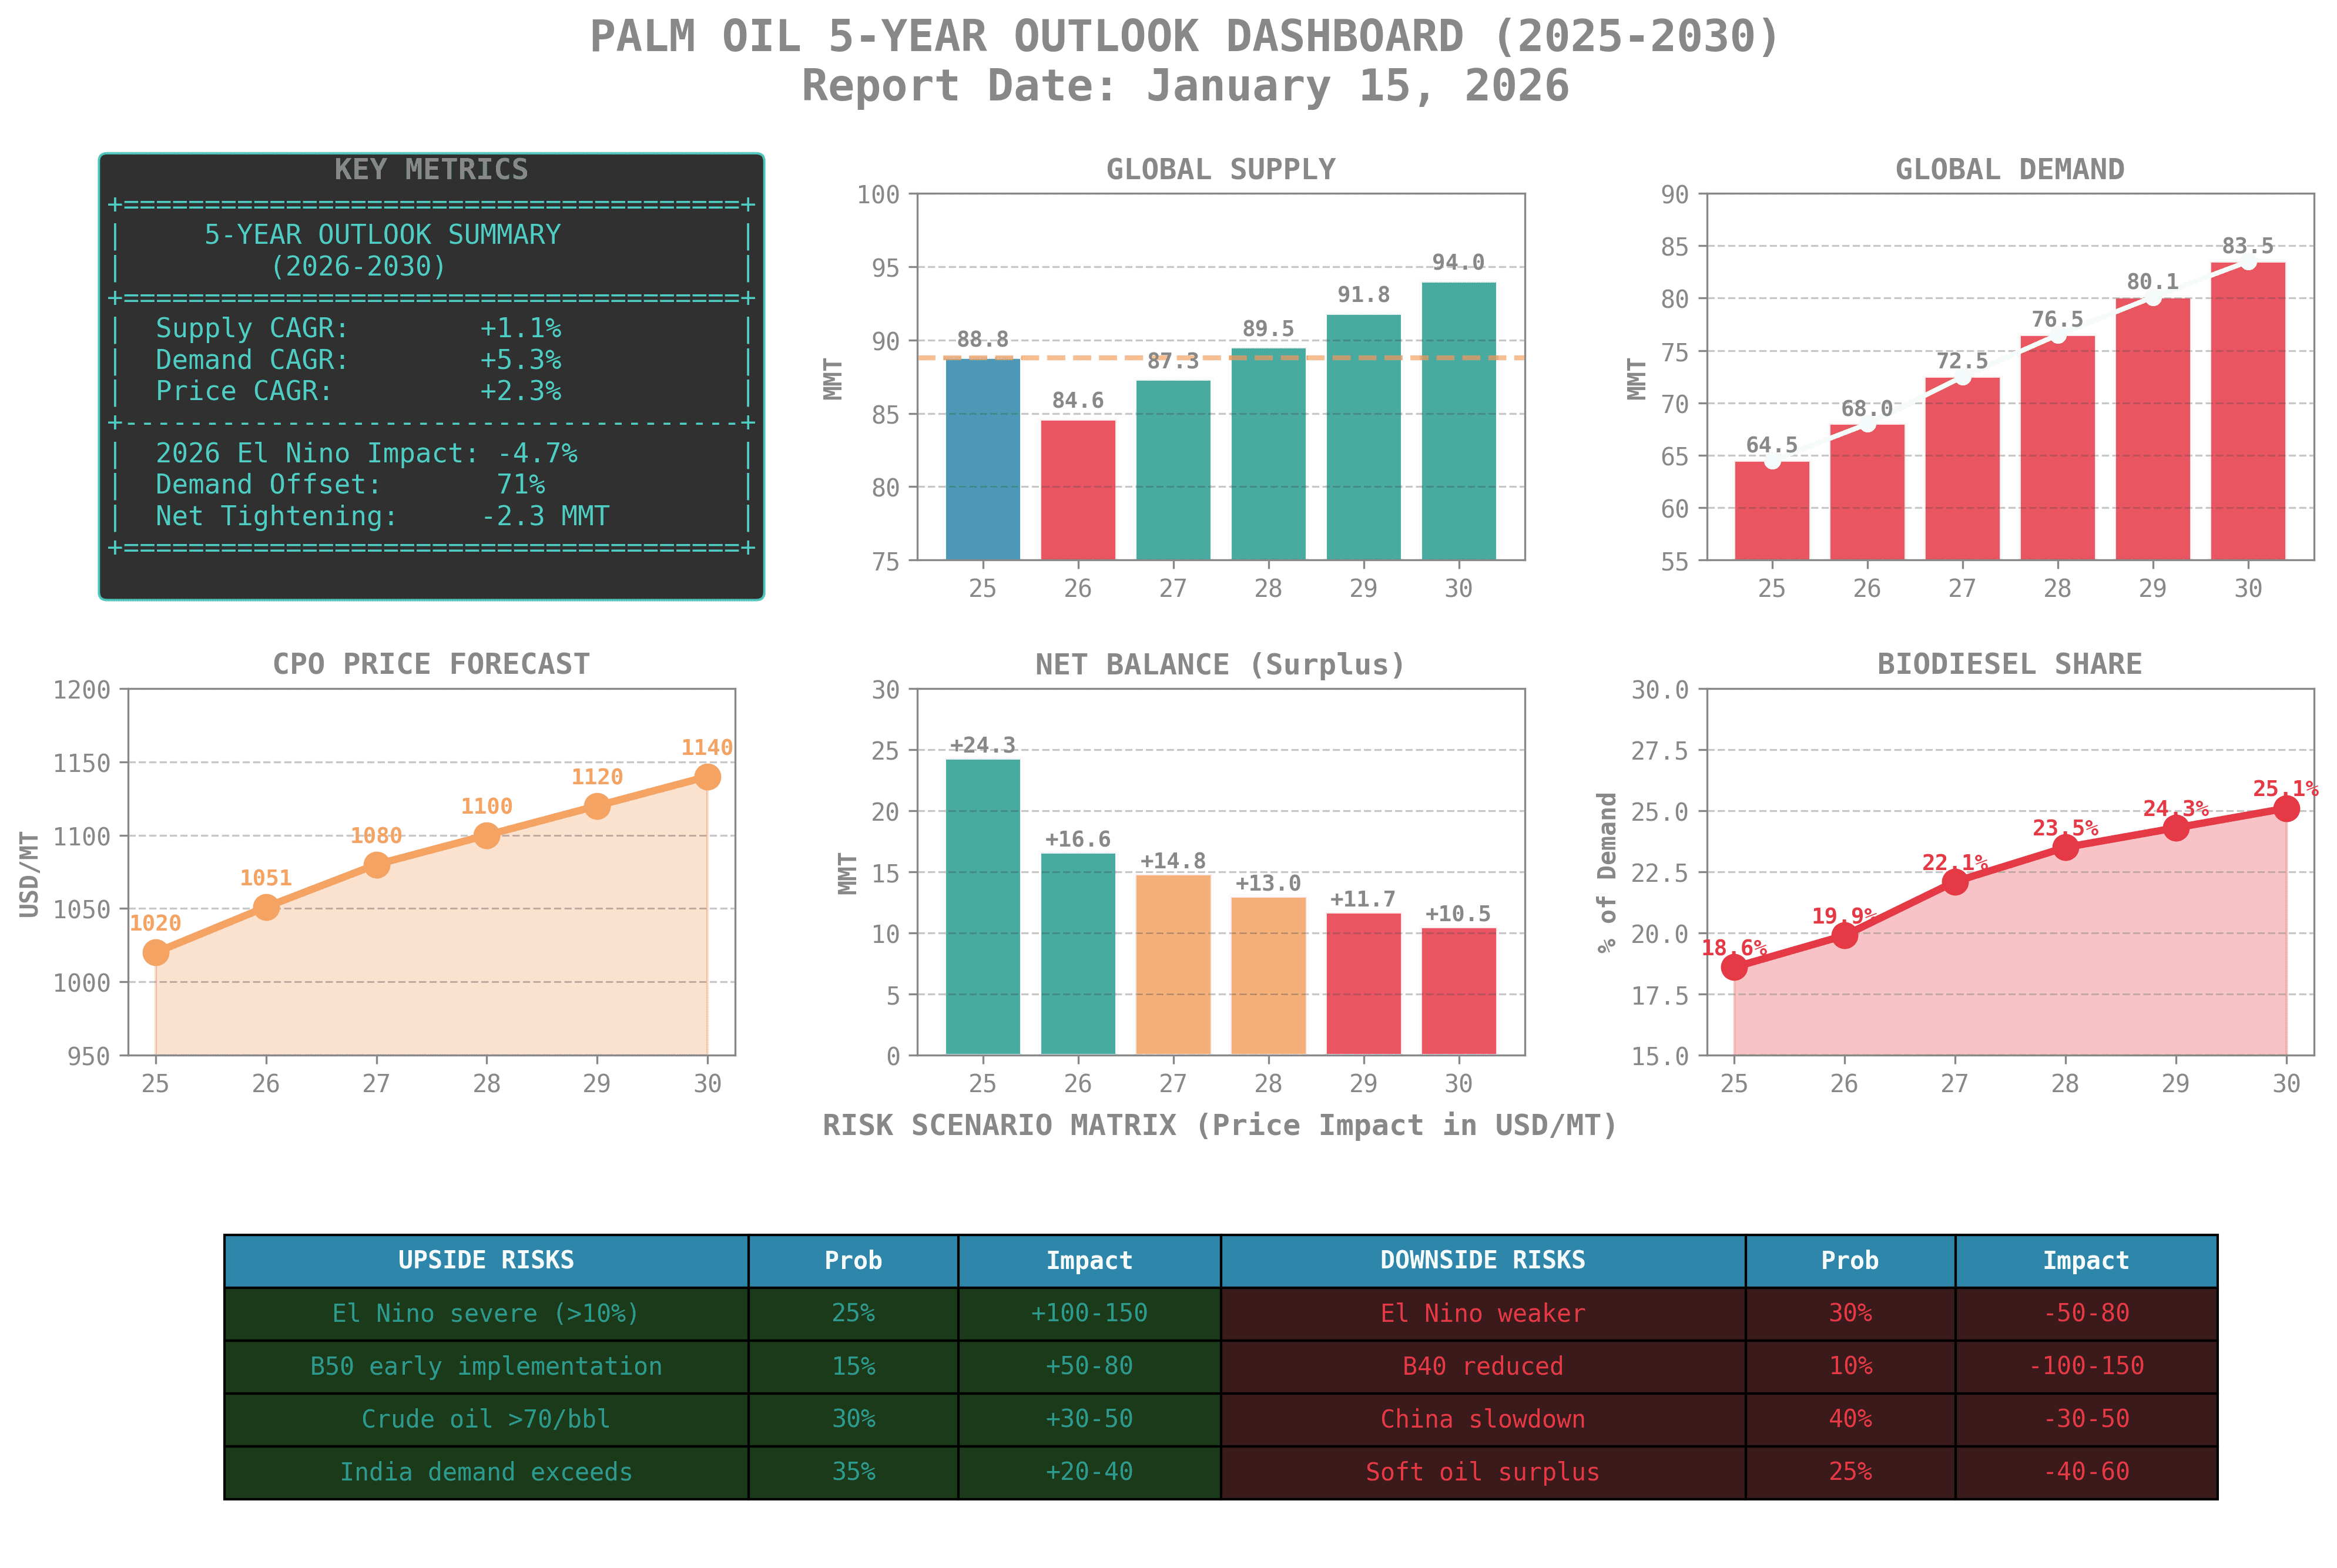
Metric | 2025 (Actual) | 2030 (Projected) | Change |
|---|---|---|---|
Global Supply | 88.78 MMT | 94.0 MMT | +5.9% |
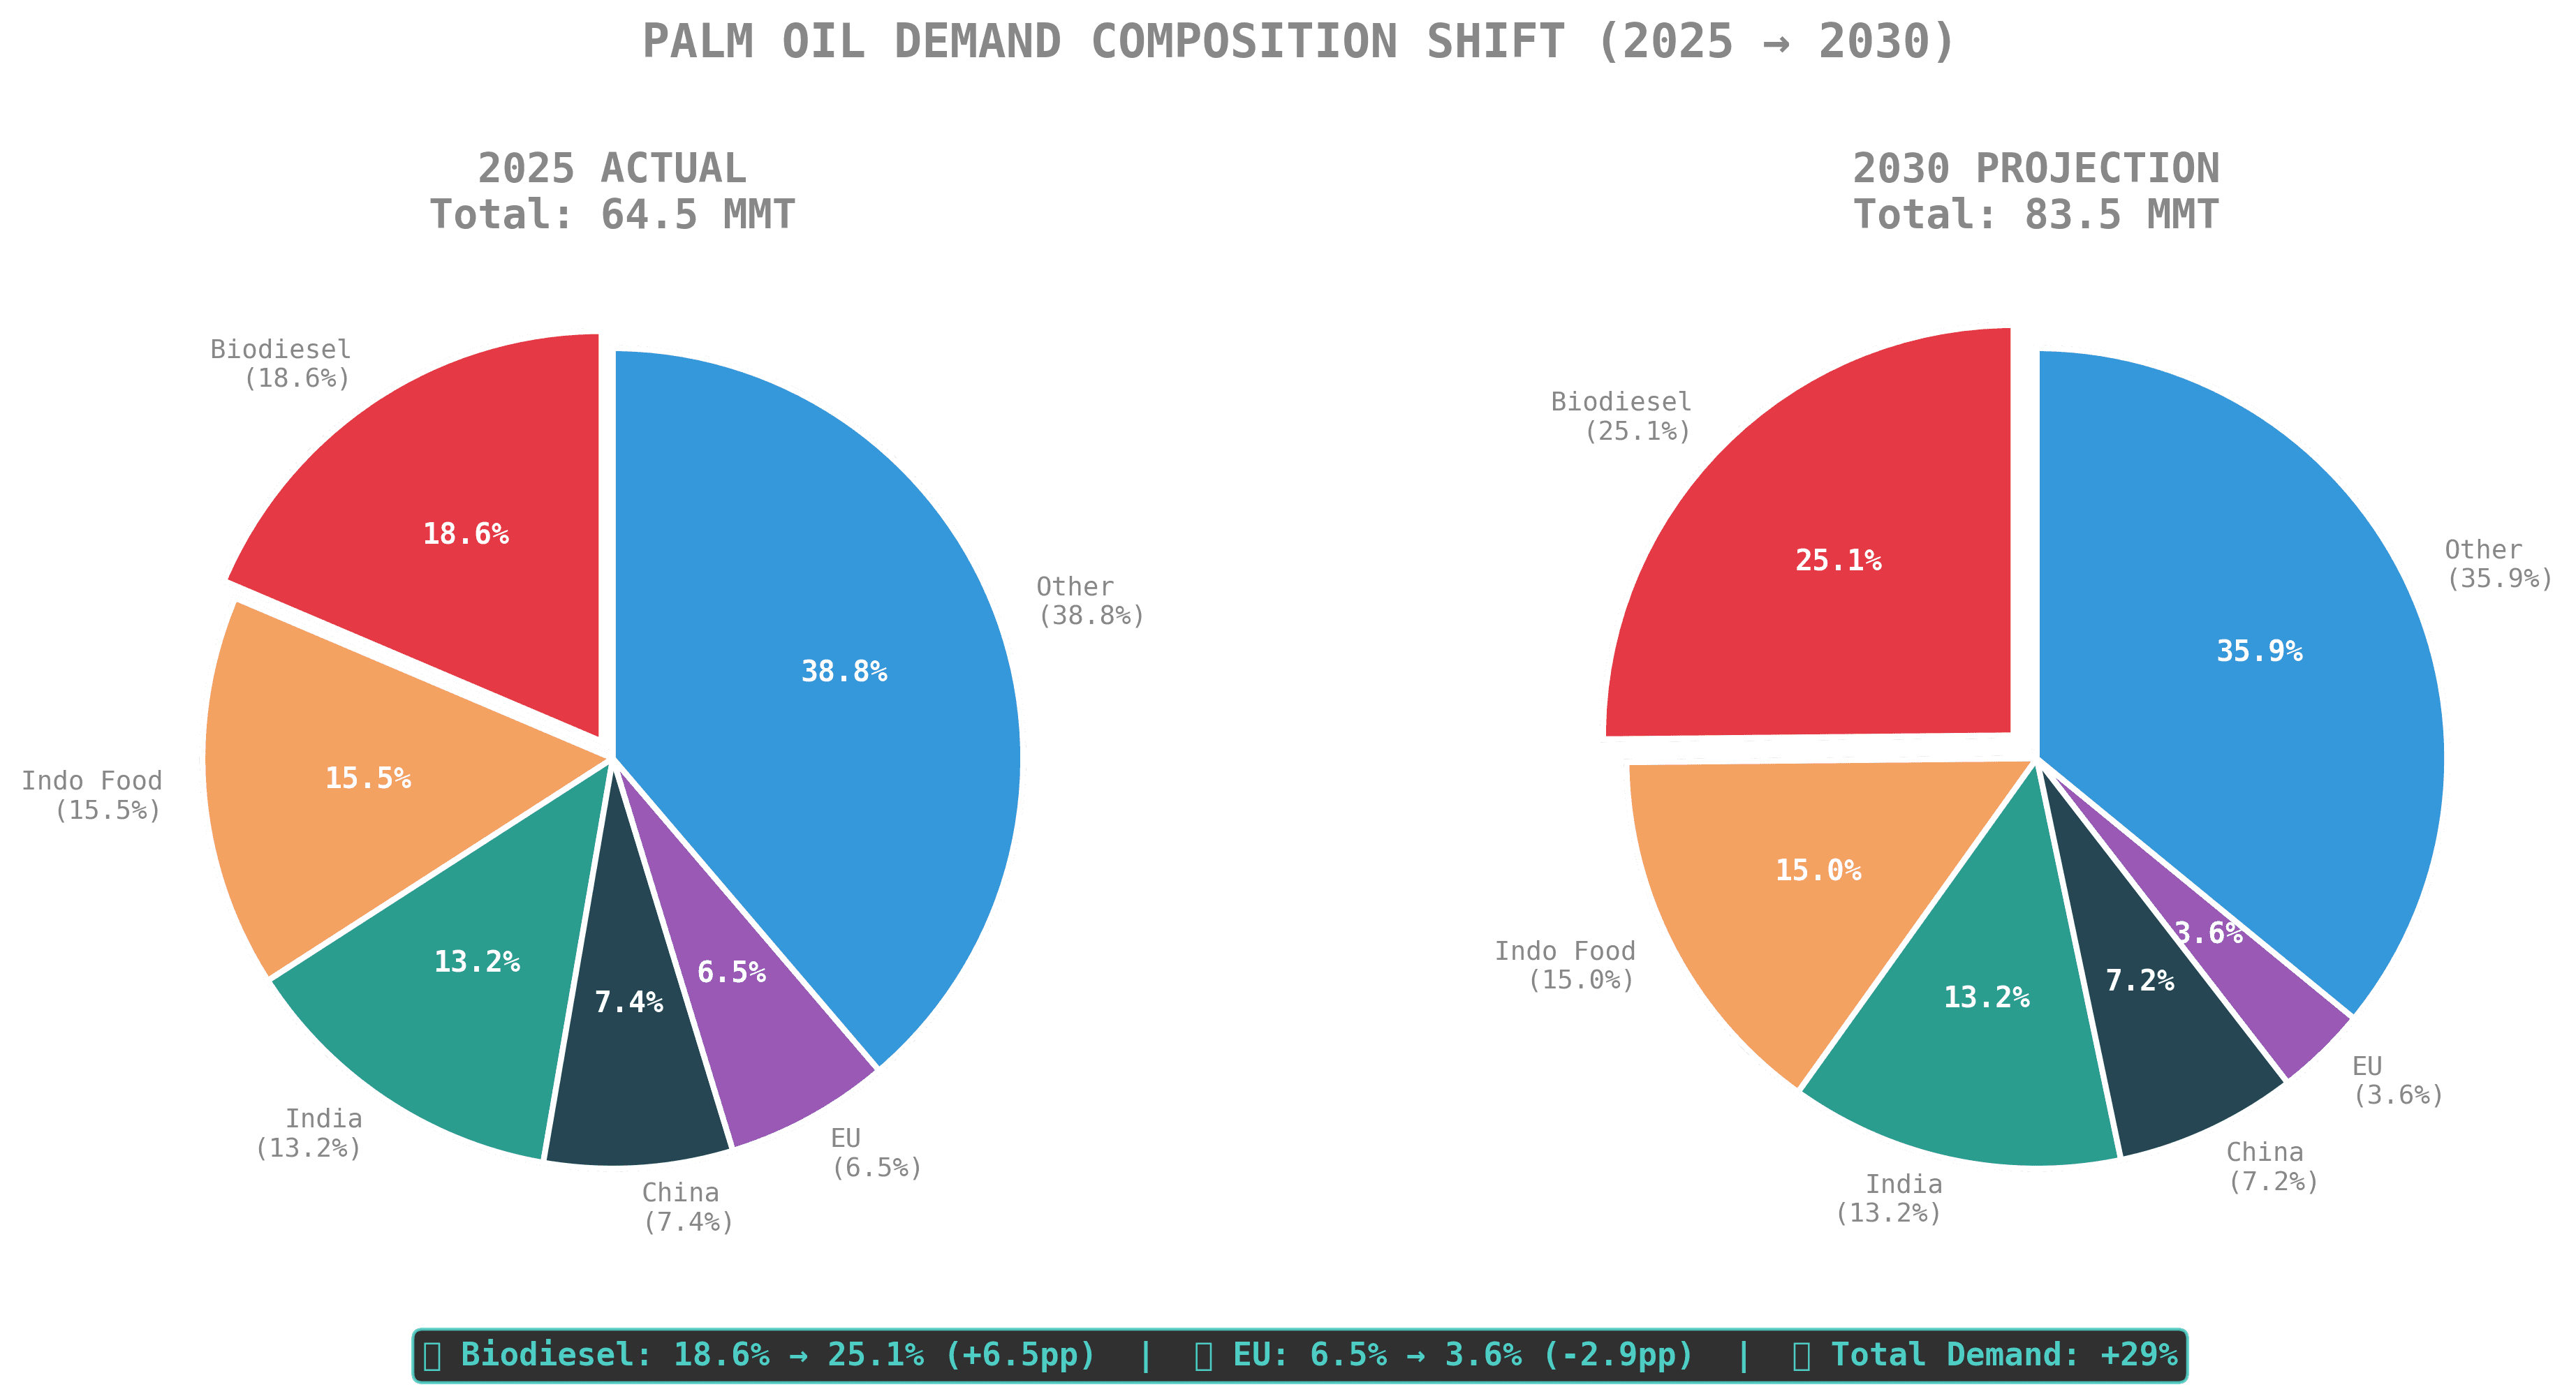
Global Demand | 64.5 MMT | 83.5 MMT | +29.5% |
Net Balance | +24.3 MMT | +10.5 MMT | -57% |
CPO Price | $1,020/MT | $1,140/MT | +12% |
Biodiesel Share | 18.6% | 25.1% | +6.5pp |
Critical Insight: The market transitions from surplus (2025) to tightening (2026) to balanced (2027-2030) as biodiesel mandates absorb production growth.
1. 2025 ACTUALS (Historical Baseline)
Metric | Value | Notes |
|---|---|---|
Indonesia Production | 56.0 MMT | +11% YoY (39.6 MMT through Sept) |
Malaysia Production | 20.28 MMT | Record high |
Other Producers | 12.5 MMT | Thailand, Colombia, Nigeria |
Global Production | 88.78 MMT | Record year |
Malaysia Ending Stocks | 3.0 MMT | Highest since 2019 |
2025 Demand Actuals
Segment | Volume (MMT) | Notes |
|---|---|---|
Indonesia Biodiesel (B40) | 12.0 | ~23% of Indonesia output |
Indonesia Food/Oleochemical | 10.0 | Domestic consumption |
India Imports | 8.5 | ~632k tonnes/month avg |
China Imports | 4.8 | Constrained by economy |
EU Imports | 4.2 | EUDR pressure building |
Other | 25.0 | ROW demand |
Global Demand | 64.5 MMT |
2025 Price Actuals
Metric | Value | Source |
|---|---|---|
CPO (USD/MT) | $1,020 | World Bank 2025 average |
CPO (MYR/MT) | RM4,100 | Bursa Malaysia average |
Soybean Oil | $1,094/MT | CME 2025 average |
WTI Crude | $65.46/bbl | EIA 2025 average |
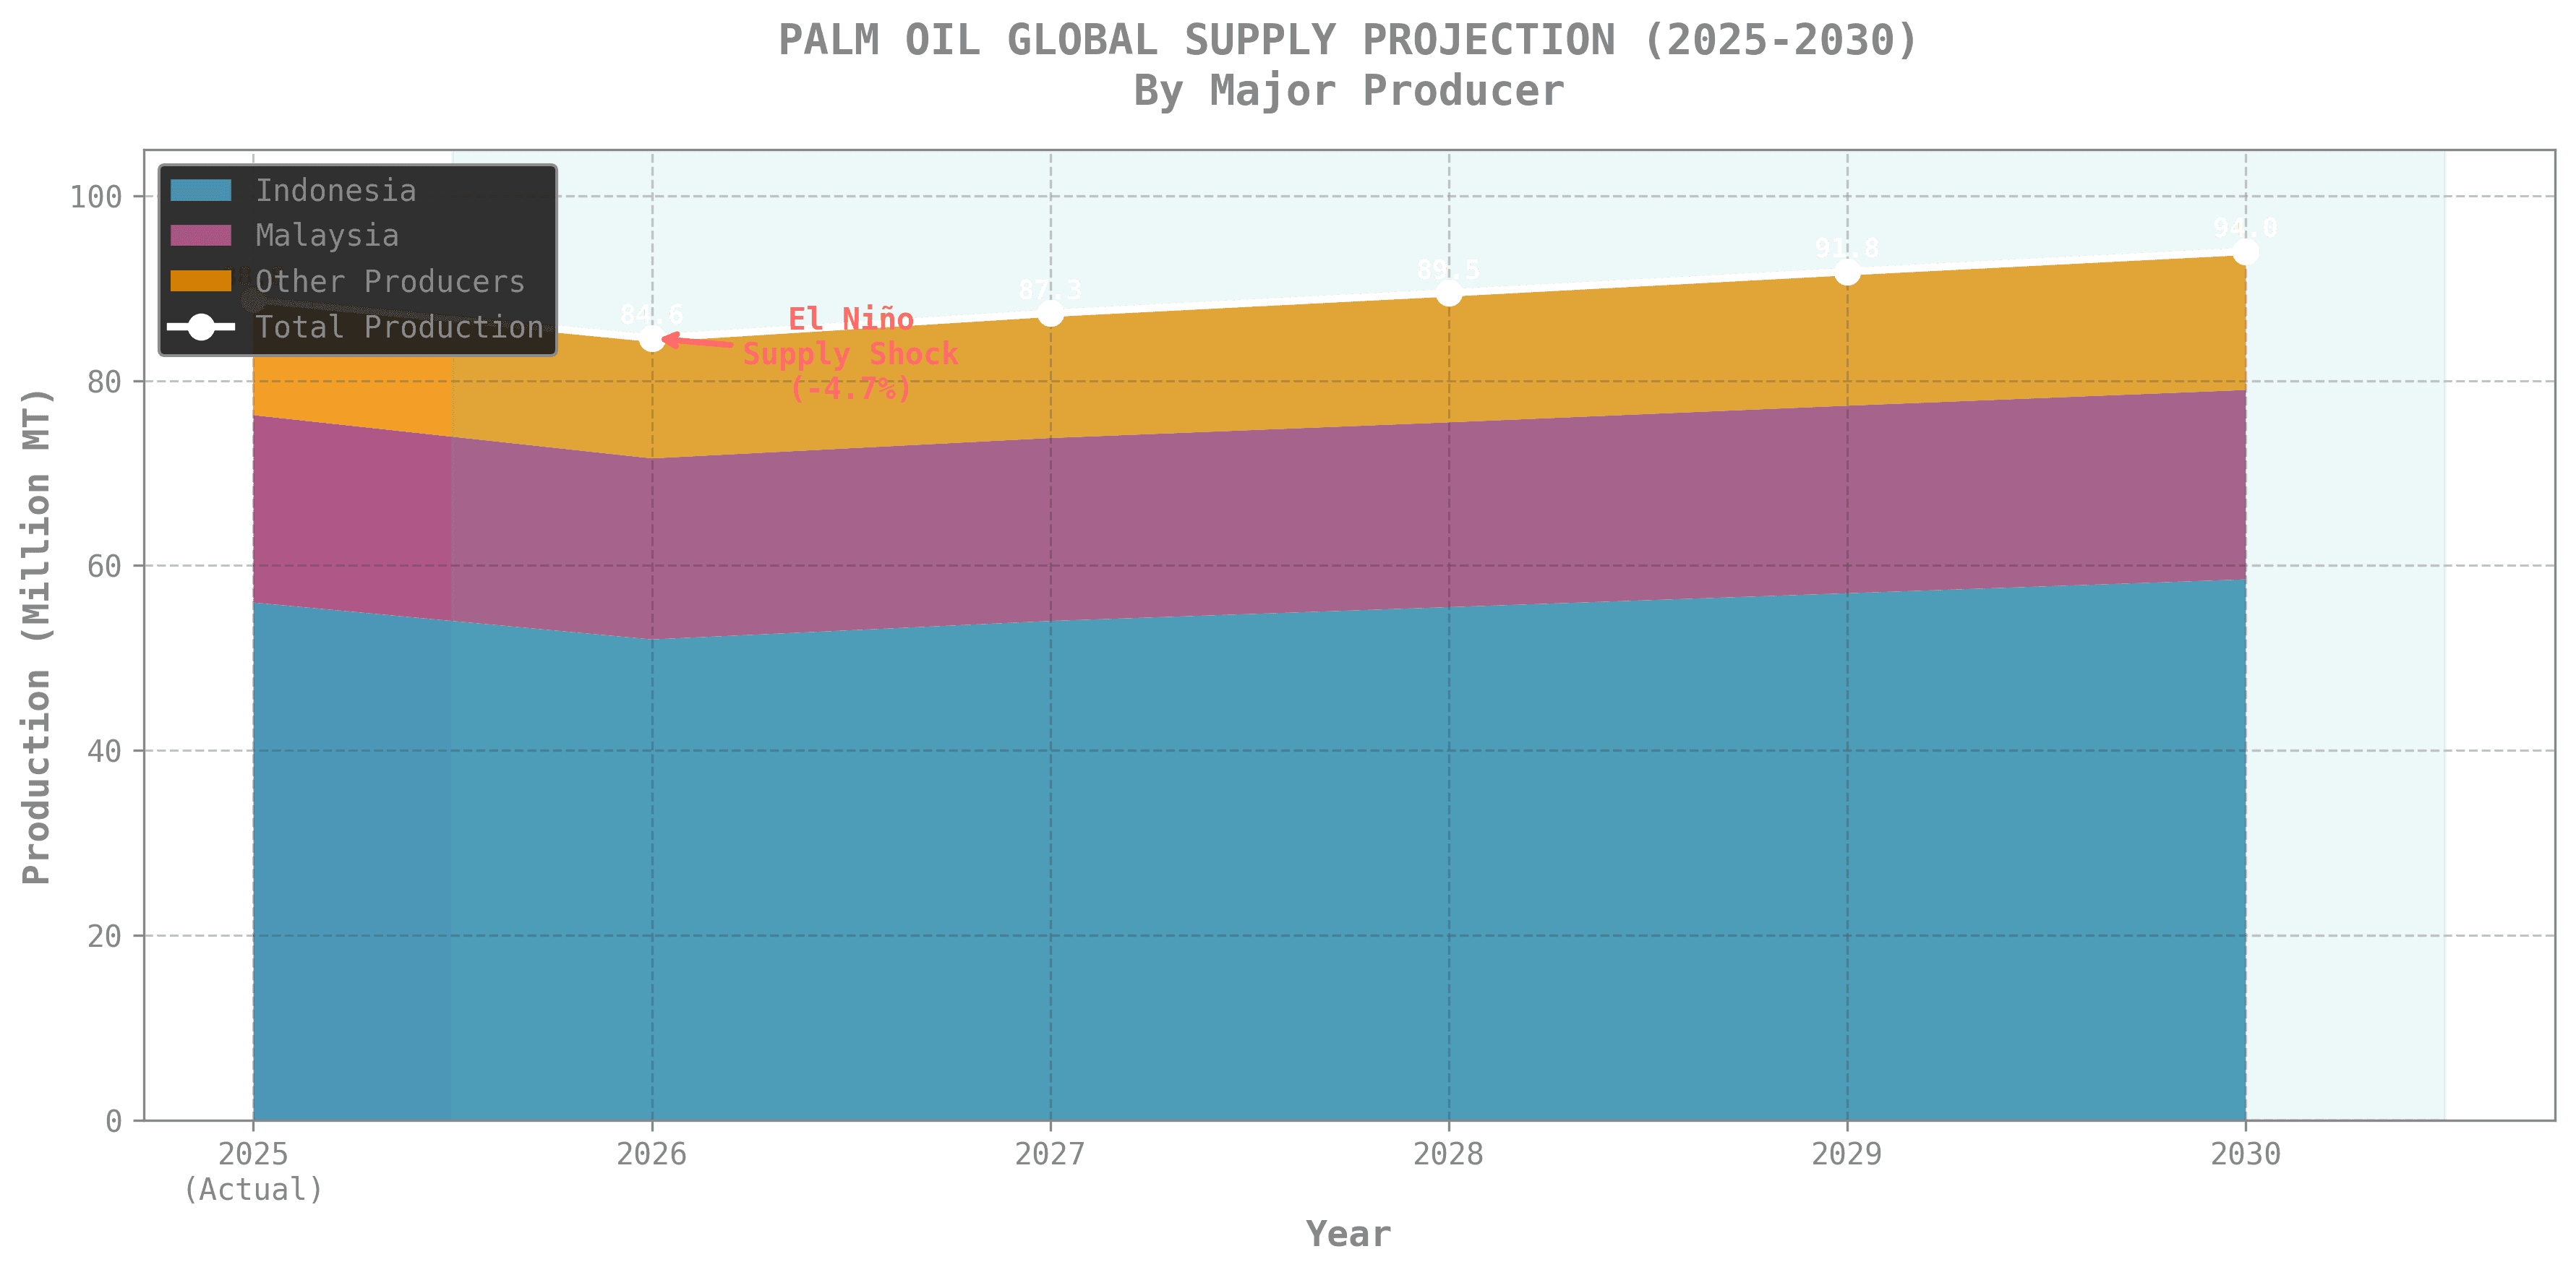
2. Supply Projections (2026-2030)
Year | Indonesia (MMT) | Malaysia (MMT) | Other (MMT) | Global (MMT) | YoY Change | Key Driver |
|---|---|---|---|---|---|---|
2025 (Actual) | 56.0 | 20.28 | 12.5 | 88.78 | — | Record year; La Niña favorable |
2026 | 52.0 | 19.6 | 13.0 | 84.6 | -4.7% | El Niño drought + land seizures |
2027 | 54.0 | 19.8 | 13.5 | 87.3 | +3.2% | Post-El Niño recovery |
2028 | 55.5 | 20.0 | 14.0 | 89.5 | +2.5% | Stable growth |
2029 | 57.0 | 20.3 | 14.5 | 91.8 | +2.6% | Continued expansion |
2030 | 58.5 | 20.5 | 15.0 | 94.0 | +2.4% | Sustainability constraints |
Supply CAGR (2025-2030): +1.1%
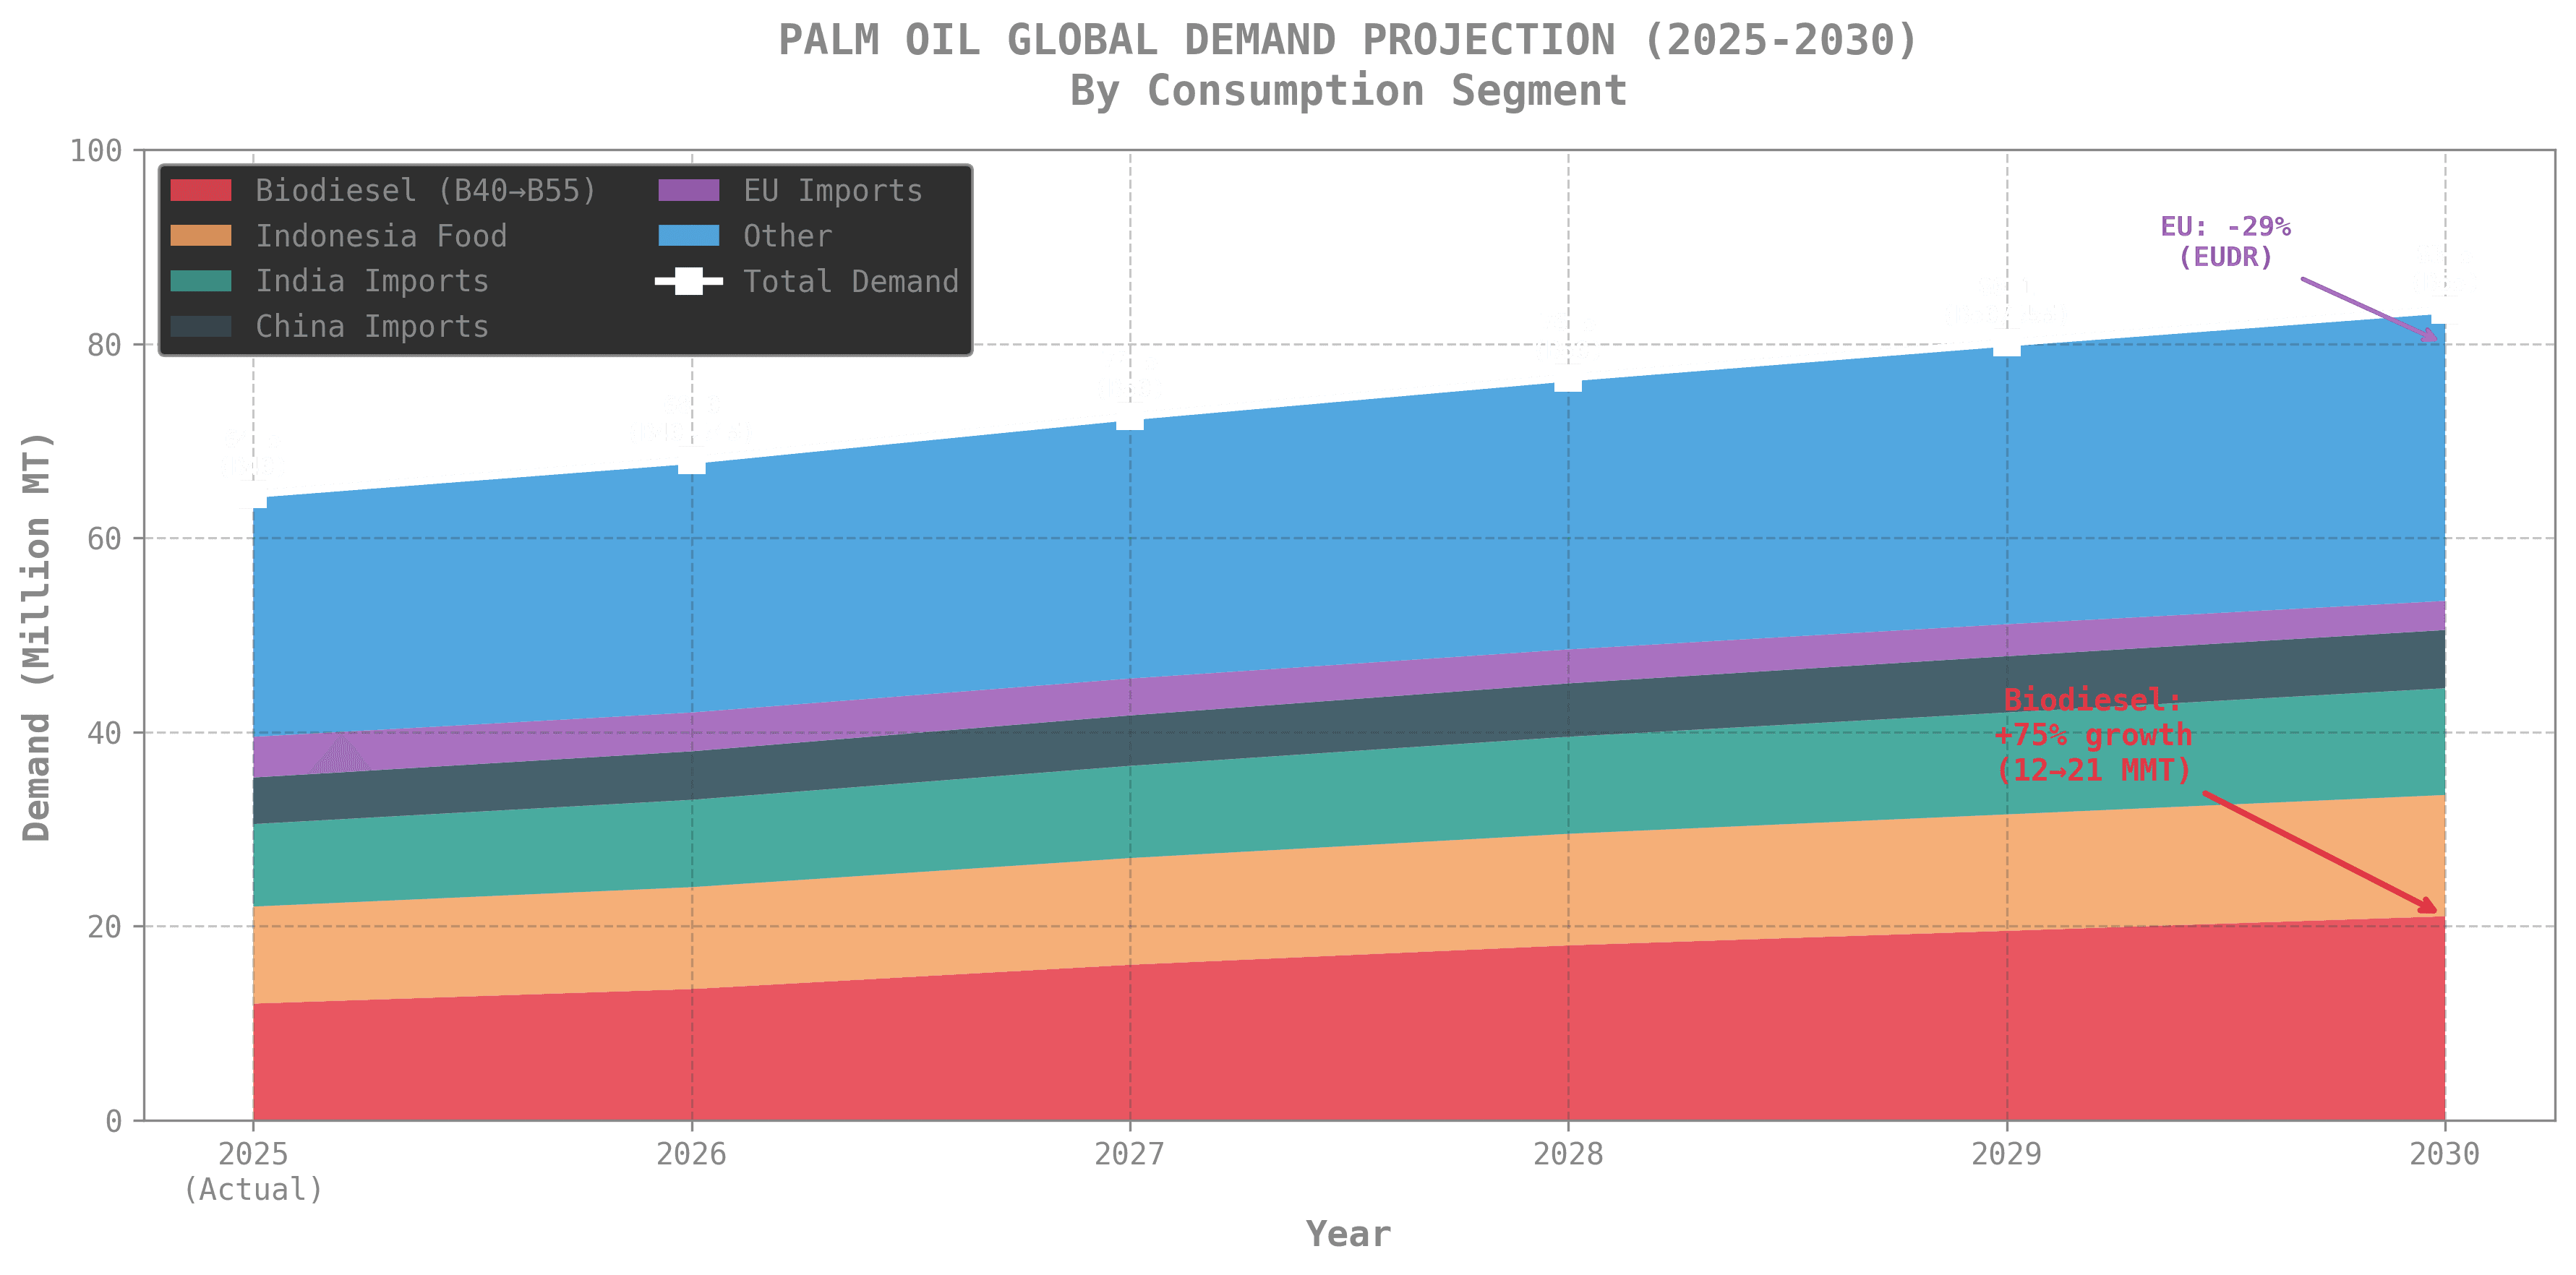
3. Demand Projections (2026-2030)
Year | Biodiesel | Indo Food | India | China | EU | Other | Total | Mandate |
|---|---|---|---|---|---|---|---|---|
2025 (Actual) | 12.0 | 10.0 | 8.5 | 4.8 | 4.2 | 25.0 | 64.5 | B40 |
2026 | 13.5 | 10.5 | 9.0 | 5.0 | 4.0 | 26.0 | 68.0 | B40→B45 |
2027 | 16.0 | 11.0 | 9.5 | 5.2 | 3.8 | 27.0 | 72.5 | B50 |
2028 | 18.0 | 11.5 | 10.0 | 5.5 | 3.5 | 28.0 | 76.5 | B50 |
2029 | 19.5 | 12.0 | 10.5 | 5.8 | 3.3 | 29.0 | 80.1 | B50/B55 |
2030 | 21.0 | 12.5 | 11.0 | 6.0 | 3.0 | 30.0 | 83.5 | B55 |
Demand CAGR (2025-2030): +5.3%
Demand Composition Shift (2025 vs 2030)
4. Supply-Demand Balance Analysis
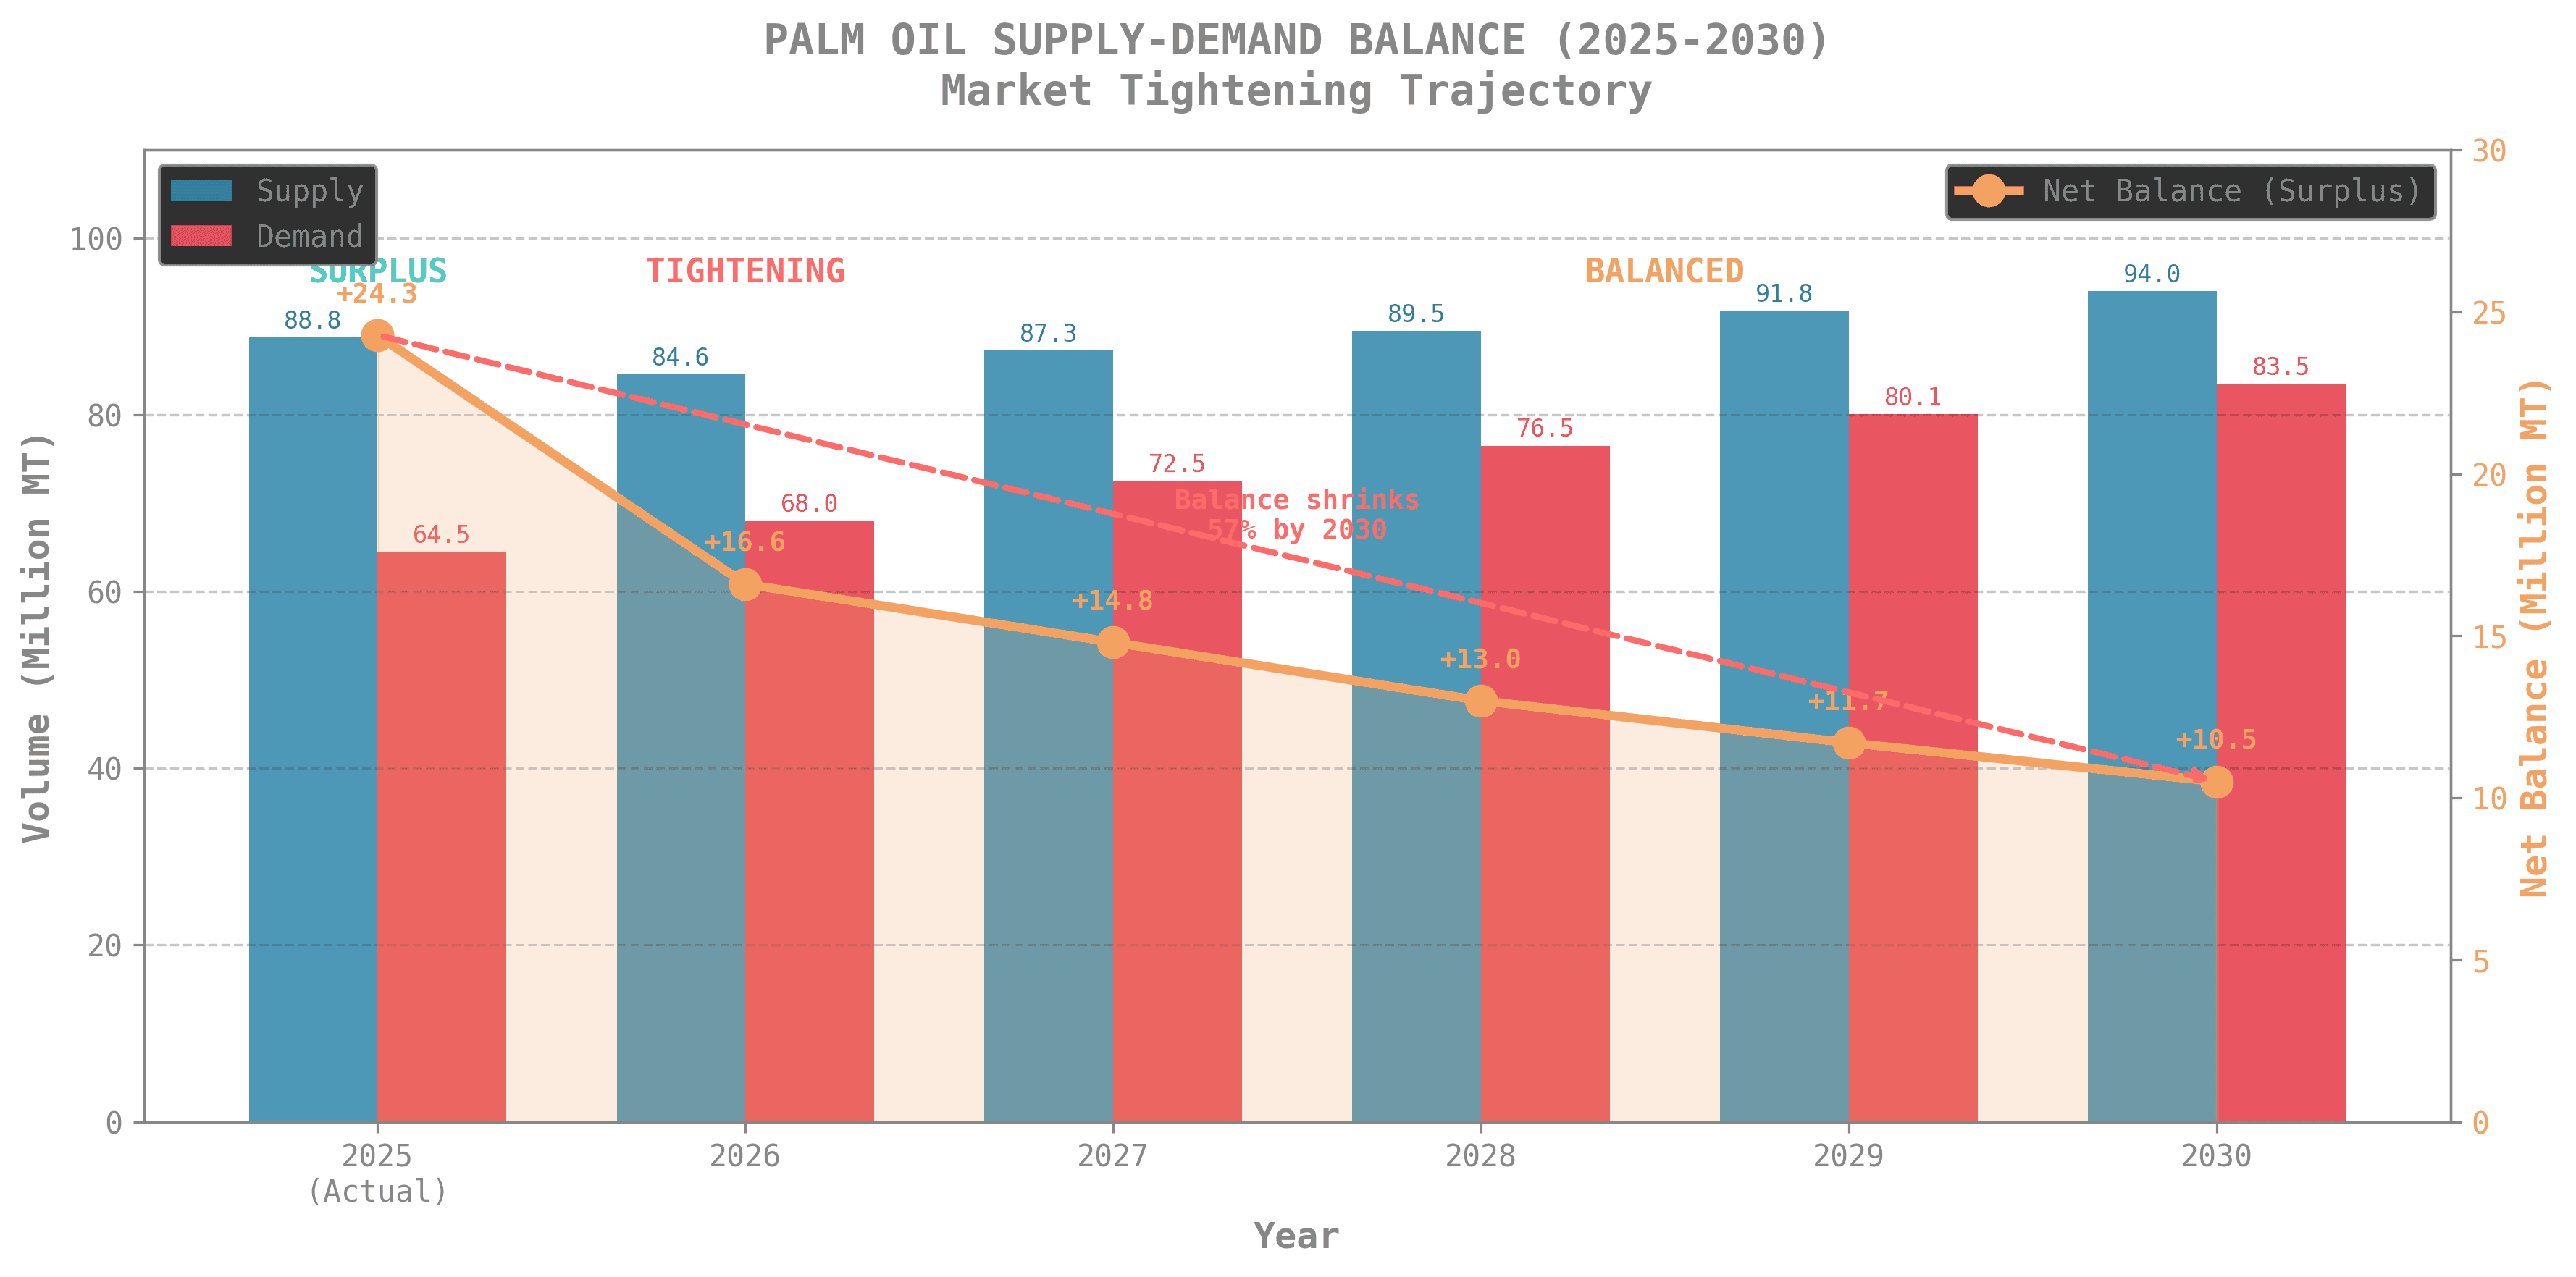
Year | Supply (MMT) | Demand (MMT) | Net Balance | Indonesia Exportable | Market Status |
|---|---|---|---|---|---|
2025 (Actual) | 88.78 | 64.5 | +24.3 MMT | 34.0 MMT | Surplus |
2026 | 84.6 | 68.0 | +16.6 MMT | 28.0 MMT | Tightening |
2027 | 87.3 | 72.5 | +14.8 MMT | 27.0 MMT | Balanced |
2028 | 89.5 | 76.5 | +13.0 MMT | 26.0 MMT | Balanced |
2029 | 91.8 | 80.1 | +11.7 MMT | 25.5 MMT | Balanced |
2030 | 94.0 | 83.5 | +10.5 MMT | 25.0 MMT | Balanced |
Key Insight: Net balance shrinks 57% from +24.3 MMT (2025) to +10.5 MMT (2030) as biodiesel mandates absorb production growth.
5. Price Projections (2026-2030)
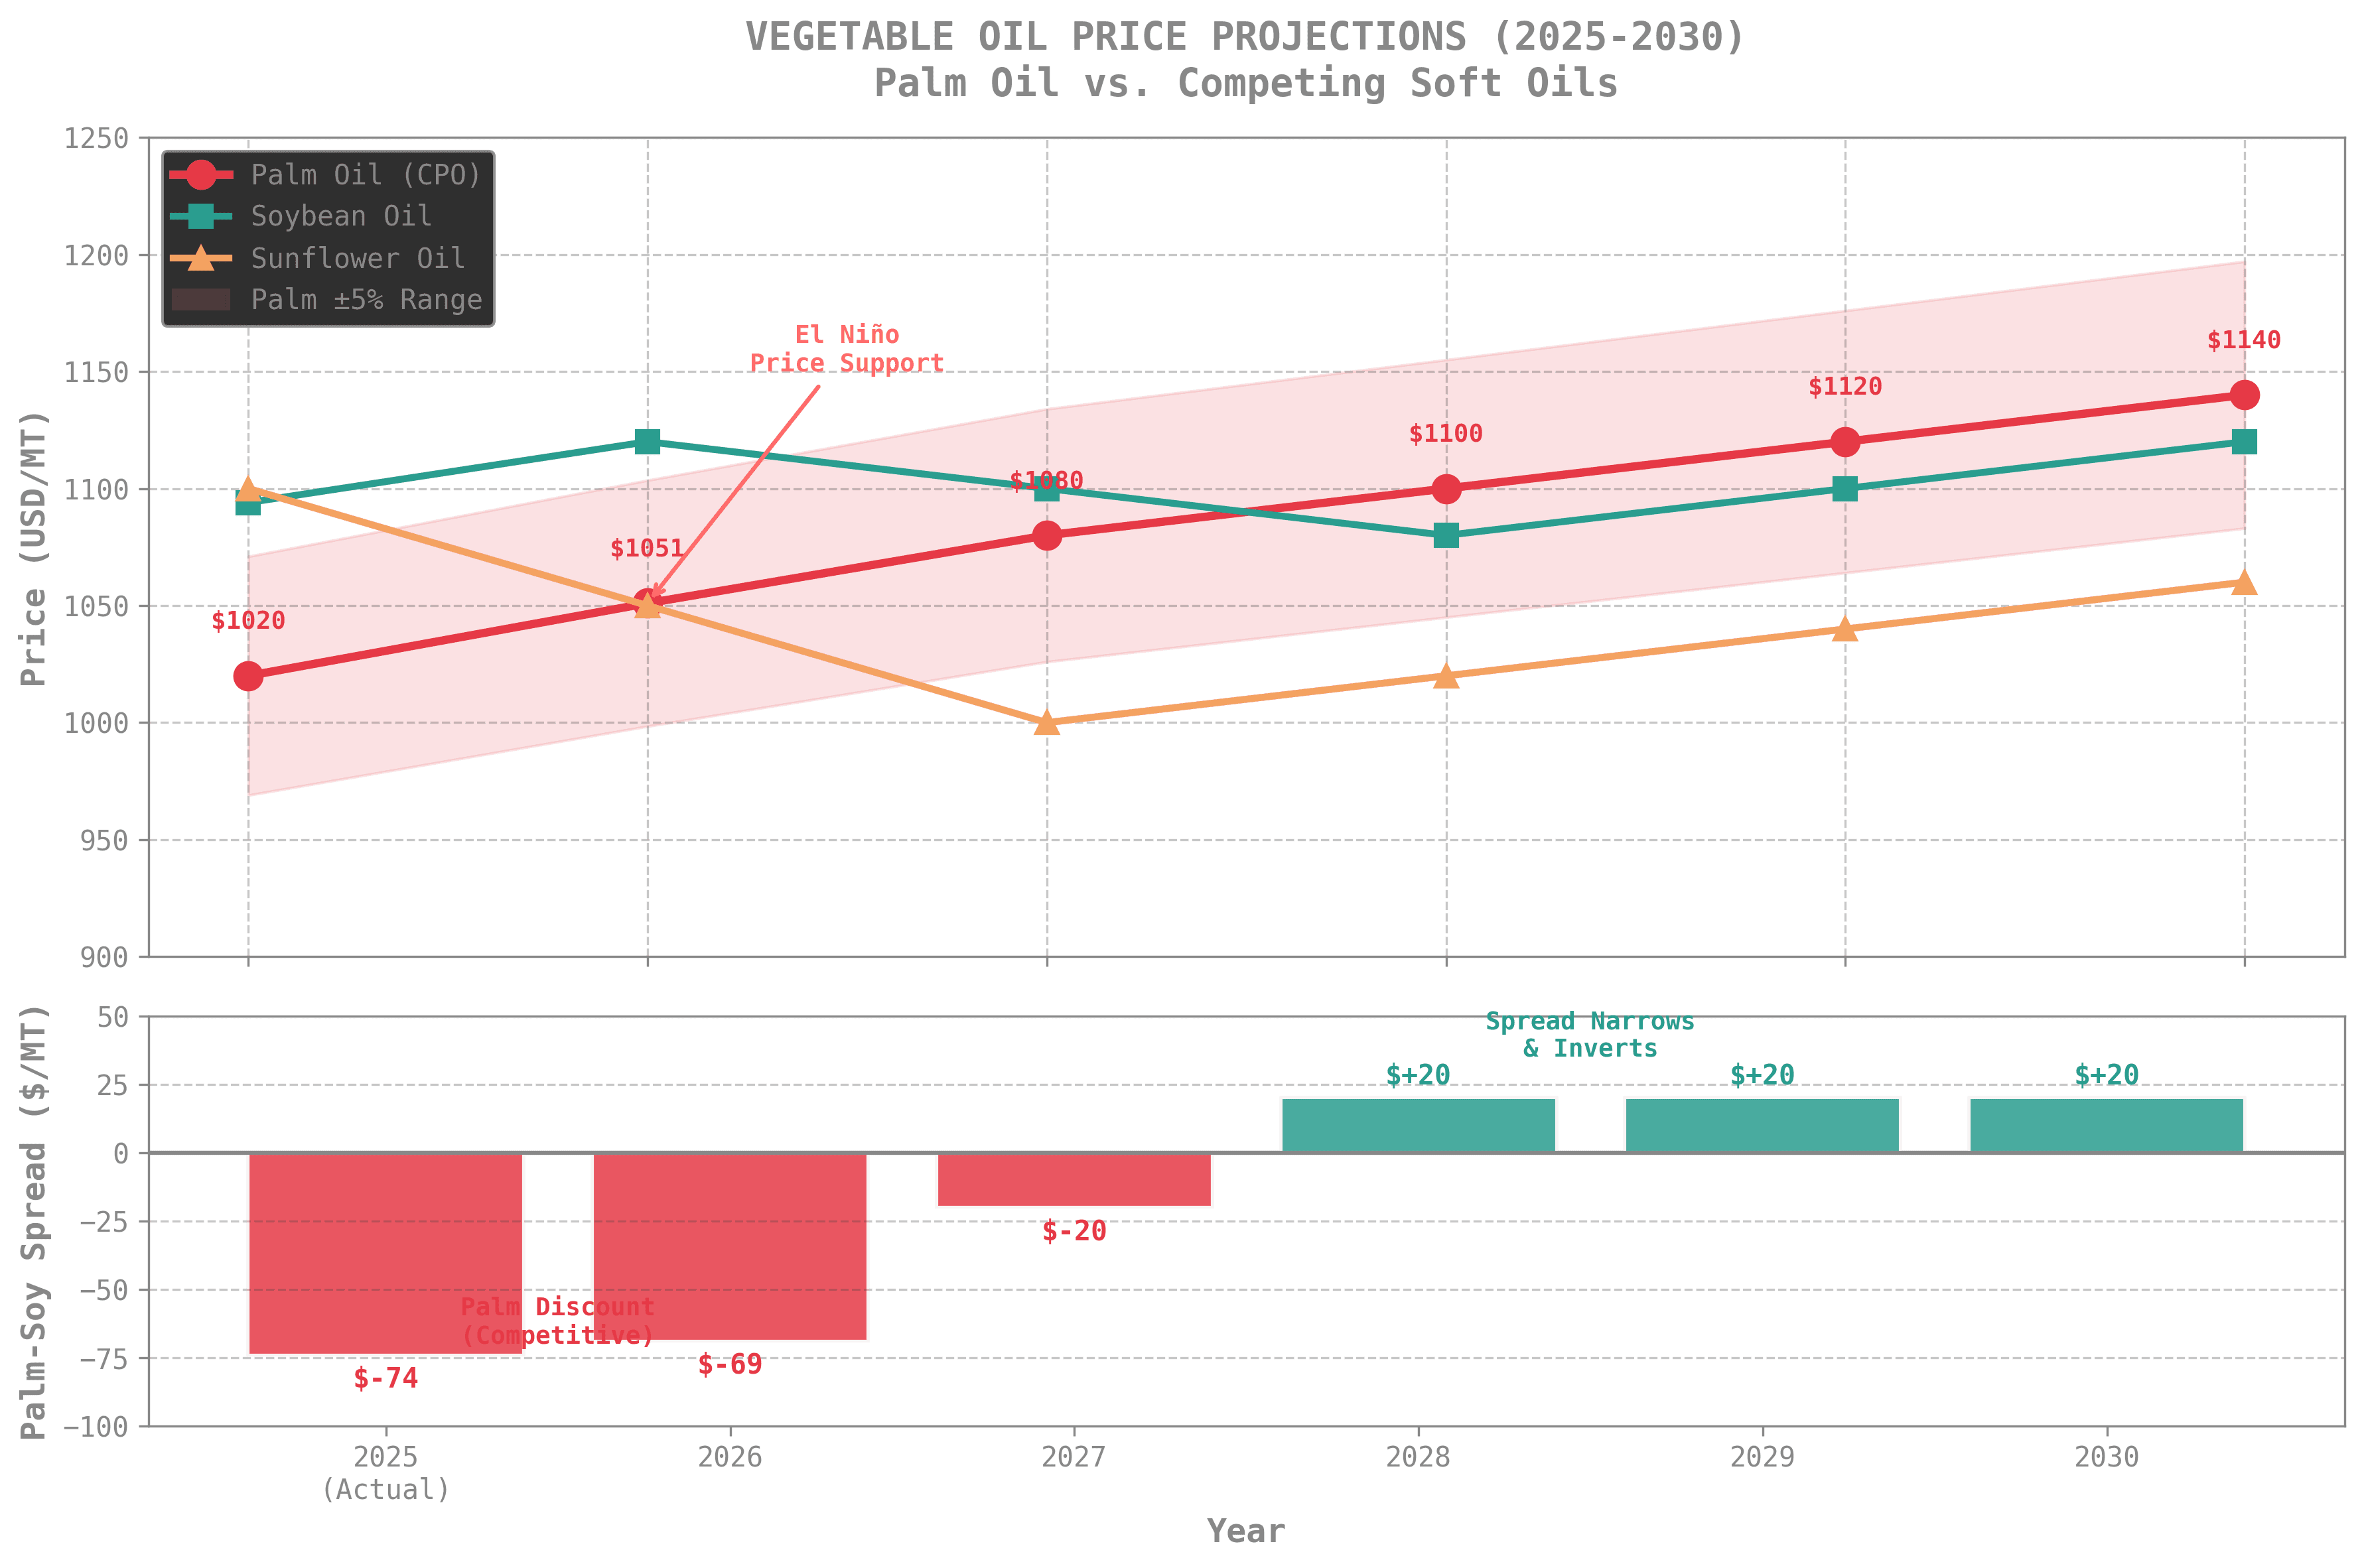
Year | CPO (USD/MT) | CPO (MYR/MT) | Soybean Oil | Sunflower Oil | Palm-Soy Spread |
|---|---|---|---|---|---|
2025 (Actual) | $1,020 | RM4,100 | $1,094 | $1,100 | -$74 |
2026 | $1,051 | RM4,200 | $1,120 | $1,050 | -$69 |
2027 | $1,080 | RM4,350 | $1,100 | $1,000 | -$20 |
2028 | $1,100 | RM4,450 | $1,080 | $1,020 | +$20 |
2029 | $1,120 | RM4,550 | $1,100 | $1,040 | +$20 |
2030 | $1,140 | RM4,650 | $1,120 | $1,060 | +$20 |
Price CAGR (2025-2030): +2.3%Key Dynamics:
Palm-soy spread narrows from -$74 (2025) to +$20 (2028-2030) as palm becomes relatively scarce
Sustainability premiums add $20-40/MT for EUDR-compliant CPO
6. El Niño Impact vs. Demand Offset (2026)
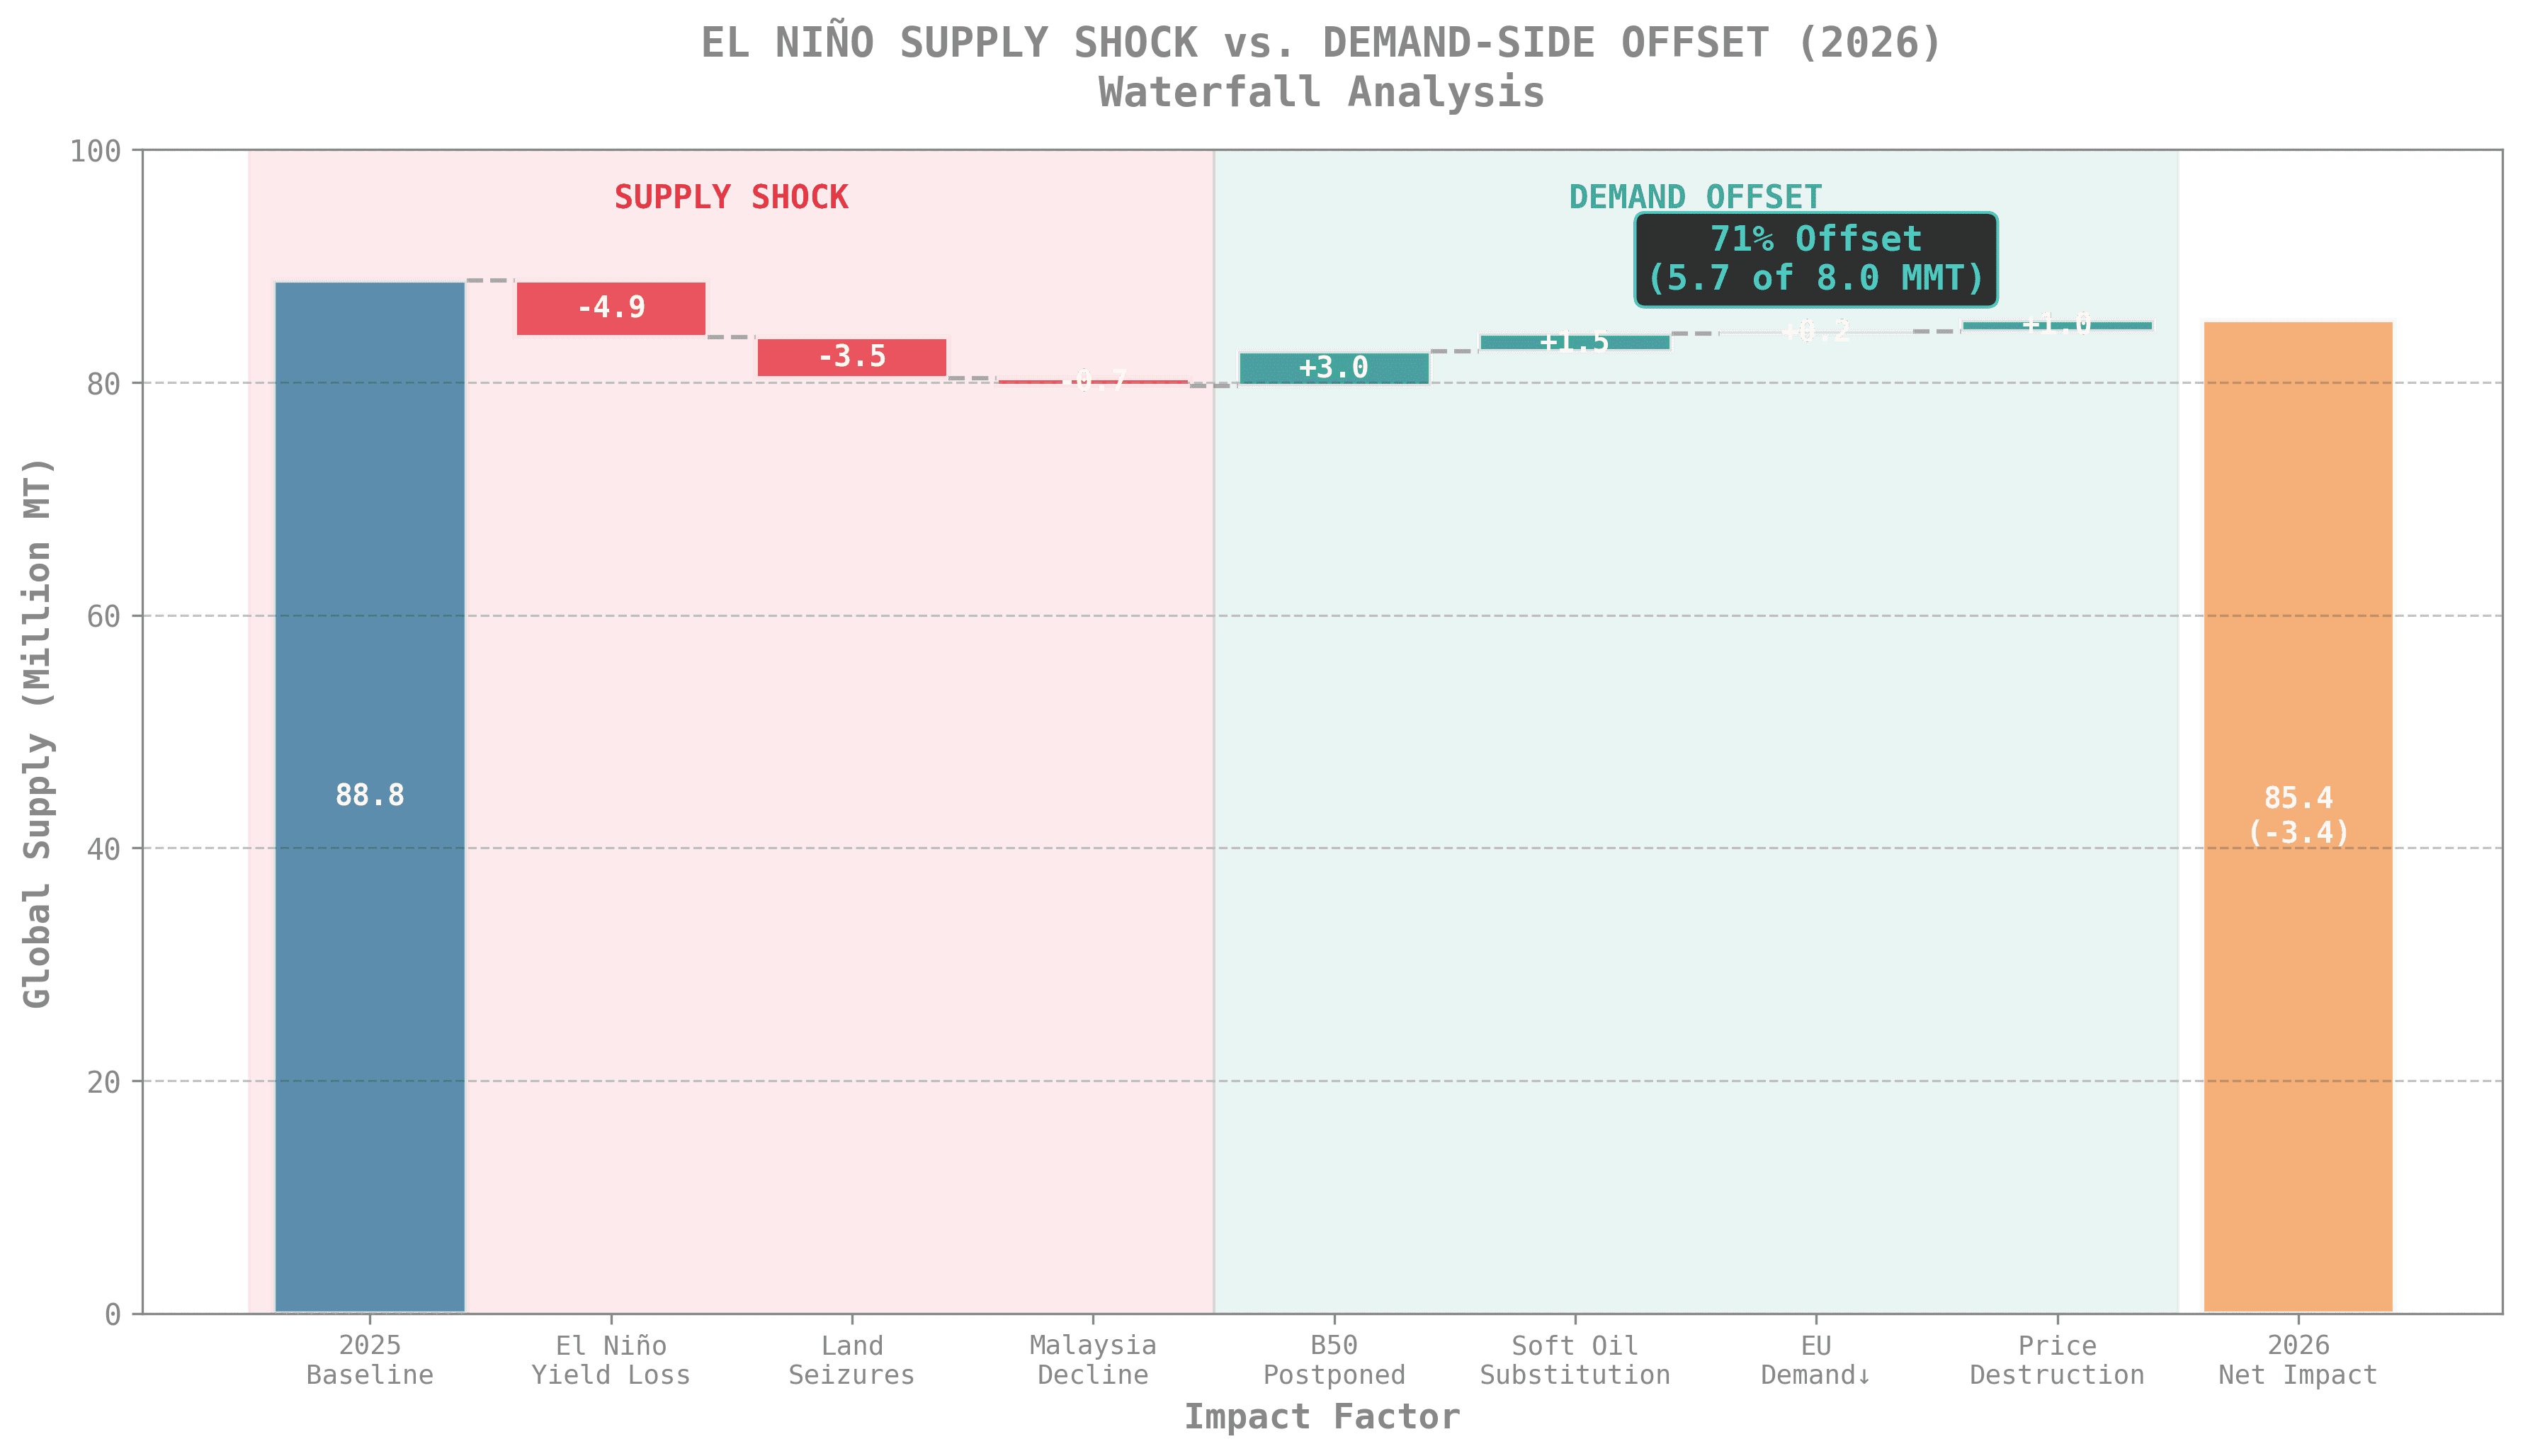
Supply Shock Quantification
Factor | Impact (MMT) |
|---|---|
El Niño yield reduction (5-10%) | -4.9 |
Indonesia land seizure risks | -3.5 |
Malaysia production decline | -0.7 |
Total Supply Reduction | -9.1 |
Demand-Side Counterbalancing Factors
Factor | Offset (MMT) | Mechanism |
|---|---|---|
B50 Postponement | +3.0 | B45 instead of B50 saves 3 MMT |
Soft Oil Substitution | +1.5 | Buyers switch to soy/sunflower |
EU Demand Destruction | +0.2 | EUDR compliance costs |
Price-Induced Destruction | +1.0 | Higher prices reduce consumption |
Total Demand Offset | +5.7 |
Net Assessment
Metric | Value |
|---|---|
Supply Shock | -9.1 MMT |
Demand Offset | +5.7 MMT |
Net Market Tightening | -3.4 MMT |
Offset Percentage | ~63% |
Conclusion: Demand-side factors offset ~63% of the El Niño supply shock, but the market still tightens significantly, supporting prices at $1,051/MT (+3% YoY).
7. Biodiesel Mandate Impact
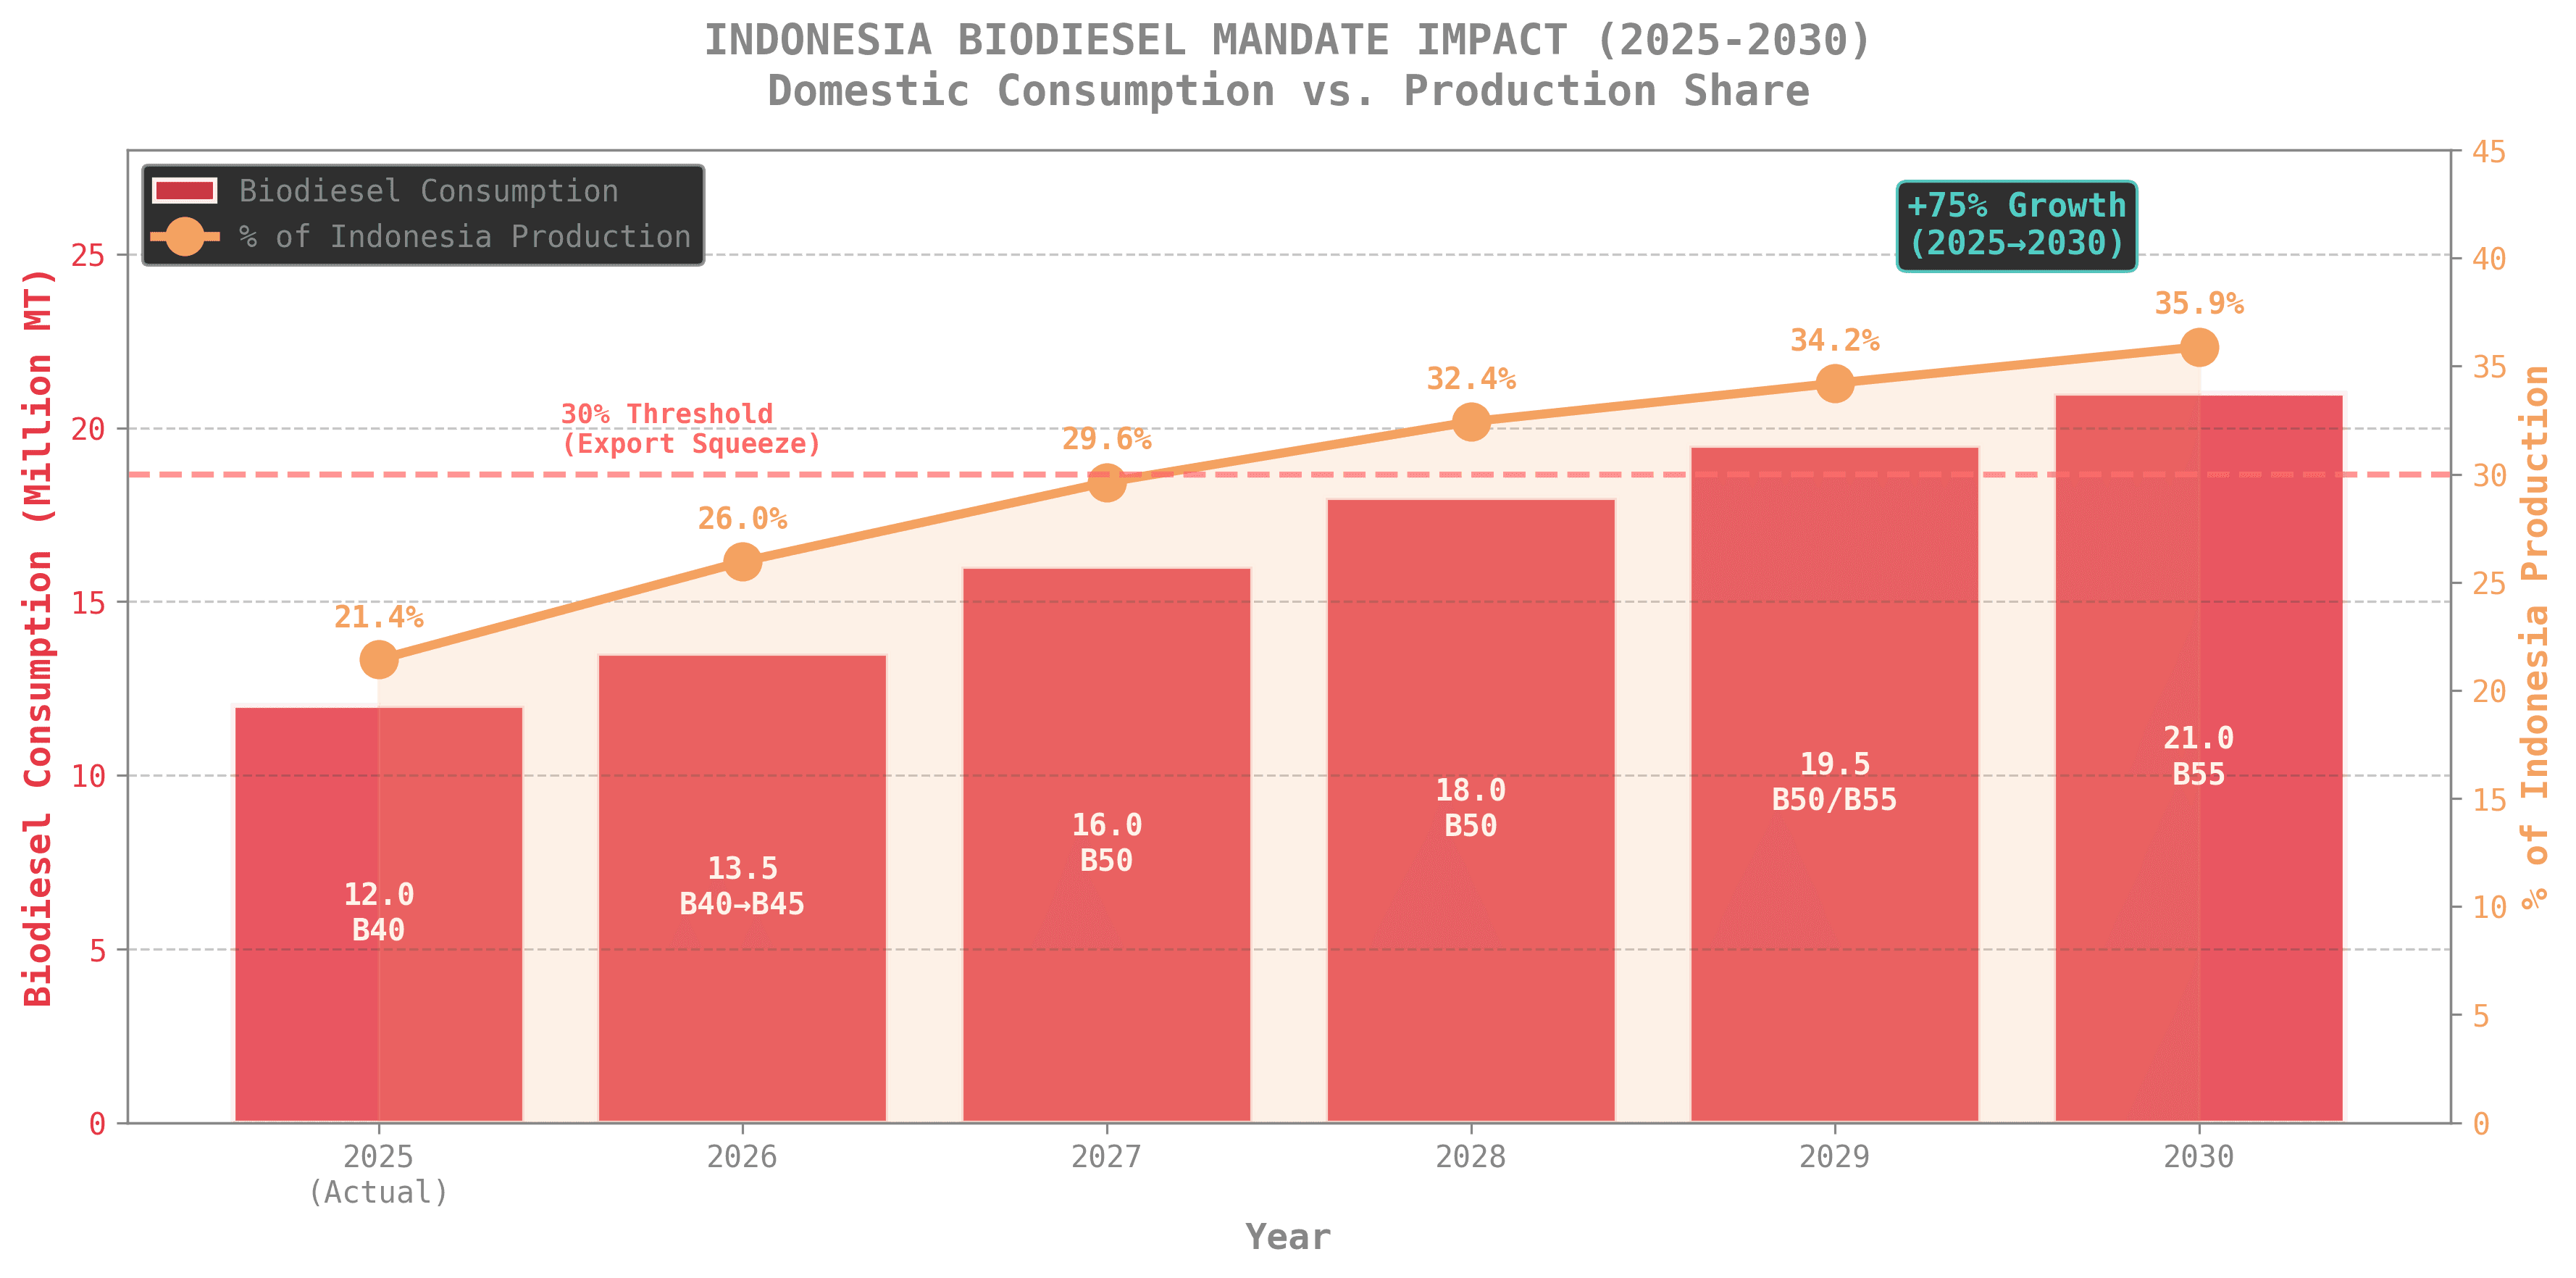
Year | Biodiesel (MMT) | % of Indonesia Production | Mandate |
|---|---|---|---|
2025 (Actual) | 12.0 | 21.4% | B40 |
2026 | 13.5 | 26.0% | B40→B45 |
2027 | 16.0 | 29.6% | B50 |
2028 | 18.0 | 32.4% | B50 |
2029 | 19.5 | 34.2% | B50/B55 |
2030 | 21.0 | 35.9% | B55 |
Key Insight: Biodiesel consumption grows 75% from 12.0 MMT (2025) to 21.0 MMT (2030), absorbing 36% of Indonesia's production by 2030.
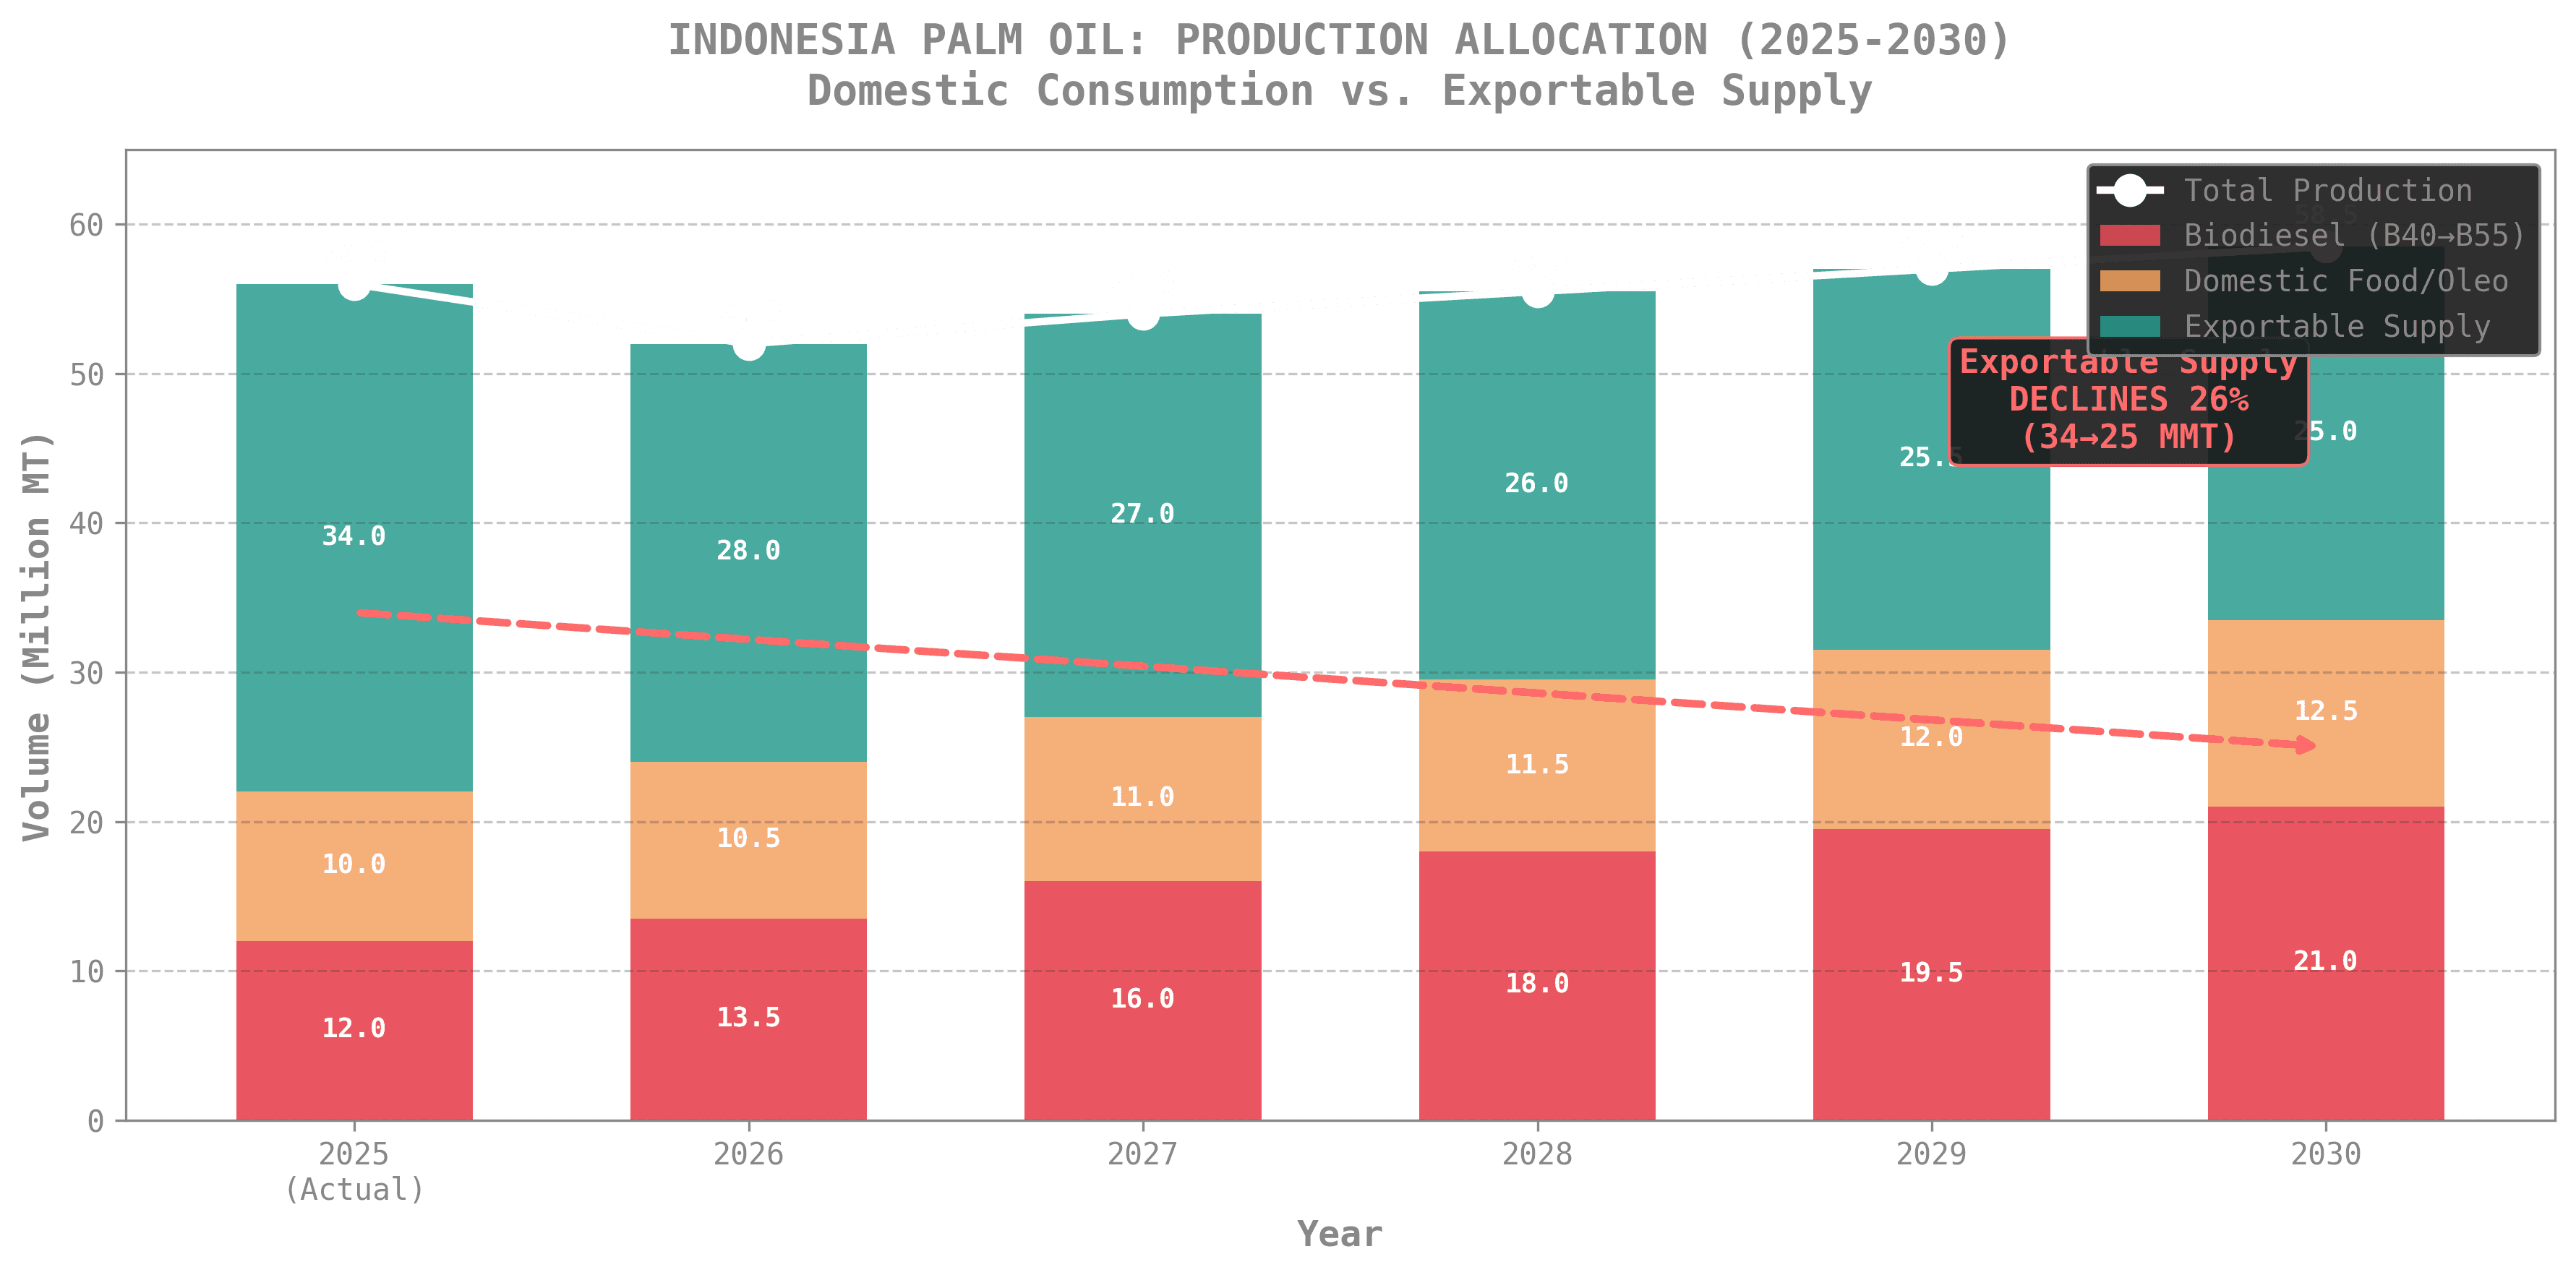
8. Indonesia Exportable Supply
Year | Production | Biodiesel | Domestic Food | Exportable | Change |
|---|---|---|---|---|---|
2025 (Actual) | 56.0 | 12.0 | 10.0 | 34.0 | — |
2026 | 52.0 | 13.5 | 10.5 | 28.0 | -18% |
2027 | 54.0 | 16.0 | 11.0 | 27.0 | -3% |
2028 | 55.5 | 18.0 | 11.5 | 26.0 | -4% |
2029 | 57.0 | 19.5 | 12.0 | 25.5 | -2% |
2030 | 58.5 | 21.0 | 12.5 | 25.0 | -2% |
Key Insight: Indonesia's exportable supply declines 26% from 34.0 MMT (2025) to 25.0 MMT (2030) as domestic biodiesel consumption absorbs production growth.
9. Risk Factors & Scenarios
Upside Risks (Higher Prices)
Risk | Probability | Price Impact |
|---|---|---|
El Niño more severe (>10% yield loss) | 25% | +$100-150/MT |
B50 implemented earlier (2026) | 15% | +$50-80/MT |
Crude oil rises above $70/bbl | 30% | +$30-50/MT |
India demand exceeds projections | 35% | +$20-40/MT |
Downside Risks (Lower Prices)
Risk | Probability | Price Impact |
|---|---|---|
El Niño weaker than expected | 30% | -$50-80/MT |
B40 mandate reduced/suspended | 10% | -$100-150/MT |
China economic slowdown deepens | 40% | -$30-50/MT |
Sunflower/soybean oil surplus | 25% | -$40-60/MT |
10. Summary: 5-Year Outlook at a Glance
Metric | 2025 (Actual) | 2026 | 2027 | 2028 | 2029 | 2030 | CAGR |
|---|---|---|---|---|---|---|---|
Supply (MMT) | 88.78 | 84.6 | 87.3 | 89.5 | 91.8 | 94.0 | +1.1% |
Demand (MMT) | 64.5 | 68.0 | 72.5 | 76.5 | 80.1 | 83.5 | +5.3% |
Balance (MMT) | +24.3 | +16.6 | +14.8 | +13.0 | +11.7 | +10.5 | — |
CPO Price ($/MT) | $1,020 | $1,051 | $1,080 | $1,100 | $1,120 | $1,140 | +2.3% |
Biodiesel Mandate | B40 | B40→B45 | B50 | B50 | B50/B55 | B55 | — |
Key Takeaways
2025 was a record year — Malaysia hit 20.28 MMT, Indonesia ~56 MMT, global supply peaked at 88.78 MMT
2026 is the inflection point — El Niño + land seizures cut supply 4.7%, while demand grows 5.4%
Biodiesel is the structural driver — Mandates absorb 75% of production growth through 2030
Prices trend higher — CPO rises from $1,020 (2025) to $1,140 (2030), +12% over 5 years
Demand-side factors provide ~63% offset to El Niño shock, but market still tightens
Data Sources
World Bank Commodity Price Forecasts - January 2026
USDA FAS Malaysia Oilseeds Update - MY 2025/26
S&P Global Malaysia Palm Oil Stocks - January 2026
CME Soybean Oil Futures (ZLH6) - Historical Data
EIA WTI Crude Oil Spot Prices - 2025 Monthly Data
USDA WASDE Report - January 2026